
Observations
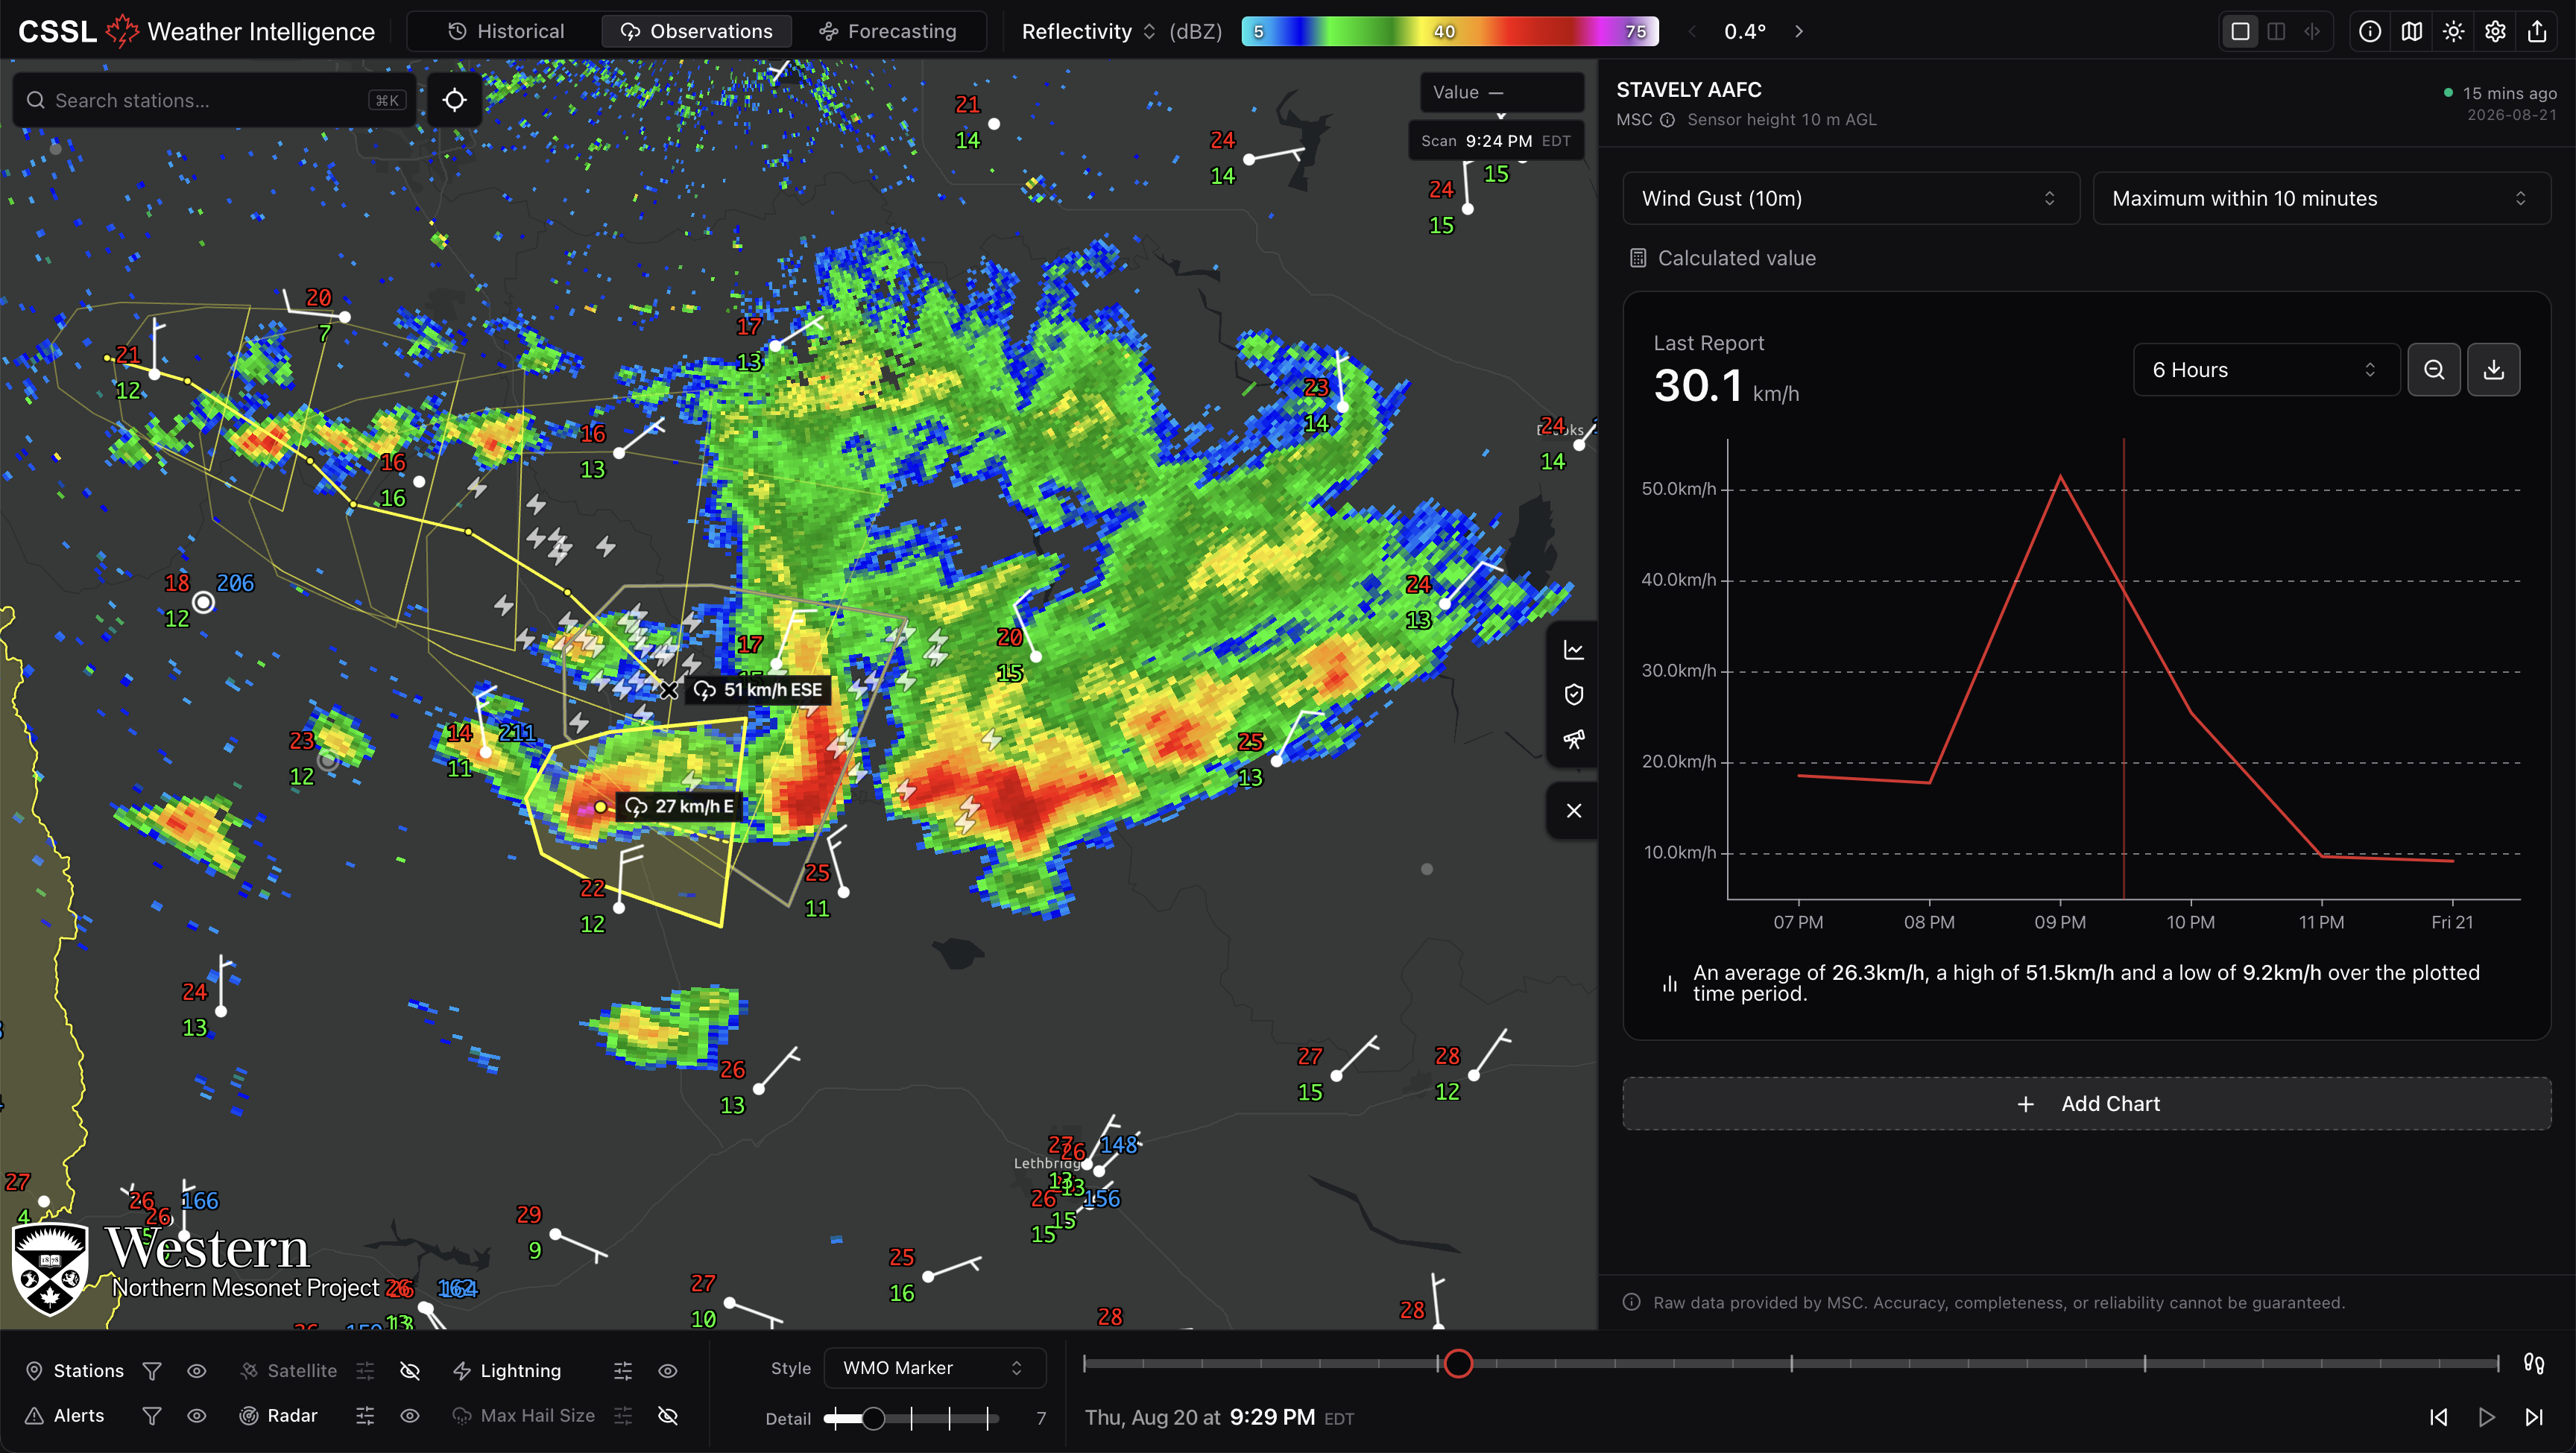
The Observations section of CSSL Weather Intelligence brings together real-time weather observations and severe weather information from across Canada in a single, interactive interface. Built on data from the Northern Mesonet Project (NMP), open-data partners, and other national and international sources, it provides an integrated view of what is happening at the surface and throughout the atmosphere.
From more than 3,300 surface weather stations to radar, satellite imagery, lightning, severe weather alerts, and hail observations, users can explore current conditions and examine how weather evolves over time.
Key Features:
- Explore observations from more than 3,300 weather stations across Canada and the United States. This includes stations from NMP networks, more than 40 open-data partner networks, and approximately 500 stations in the United States. Surface station data are plotted using conventions consistent with guidelines recommended by the World Meteorological Organization (WMO), providing a consistent presentation of observations despite differences between individual networks.
- Quickly narrow the available observations using filters for network, weather variable, and data recency. These tools make it easy to focus on the stations and observations most relevant to a particular event or analysis.
- Plot multiple meteorological variables simultaneously and analyze observations over custom periods of time.
- Access individual radar stations across Canada, along with selected U.S. radar stations near the Canadian border. Radar data can be explored alongside surface observations and other weather information to provide a comprehensive view of precipitation and storm structure.
- Explore satellite observations alongside surface and radar data to monitor cloud cover, developing weather systems, and severe weather.
- View lightning observations from the National Lightning Detection Network through MRMS, providing detailed information on lightning activity associated with thunderstorms.
- Radar, satellite, lightning, alerts, hail, and other observations are tied to a common timeline, allowing users to quickly scrub backward and forward through an event. Graphs indicate the user's current position in the timeline, making it easy to connect changes in the atmosphere with what is being observed at the surface.
- View forecasts from CSSL alongside forecasts from ECCC and Nadocast, allowing observed conditions to be compared with available forecasts.
- Multiple tabs can be kept open in the side panel, making it easy to switch between weather stations, forecasts, and other information without losing your place. Weather station data also update rapidly when navigating through the timeline.