
Forecasting
The Forecasting section of CSSL Weather Intelligence provides access to numerical weather prediction models and derived severe weather parameters in a single, interactive interface. Users can explore forecasts from multiple national and international modelling systems, compare model guidance, and examine the atmospheric conditions expected to develop over the forecast period.
From high-resolution regional models such as HRDPS and HRRR to global models including RDPS, GFS, and ICON, CSSL Weather Intelligence provides a range of forecast products alongside parameters specifically calculated by CSSL for severe weather analysis.
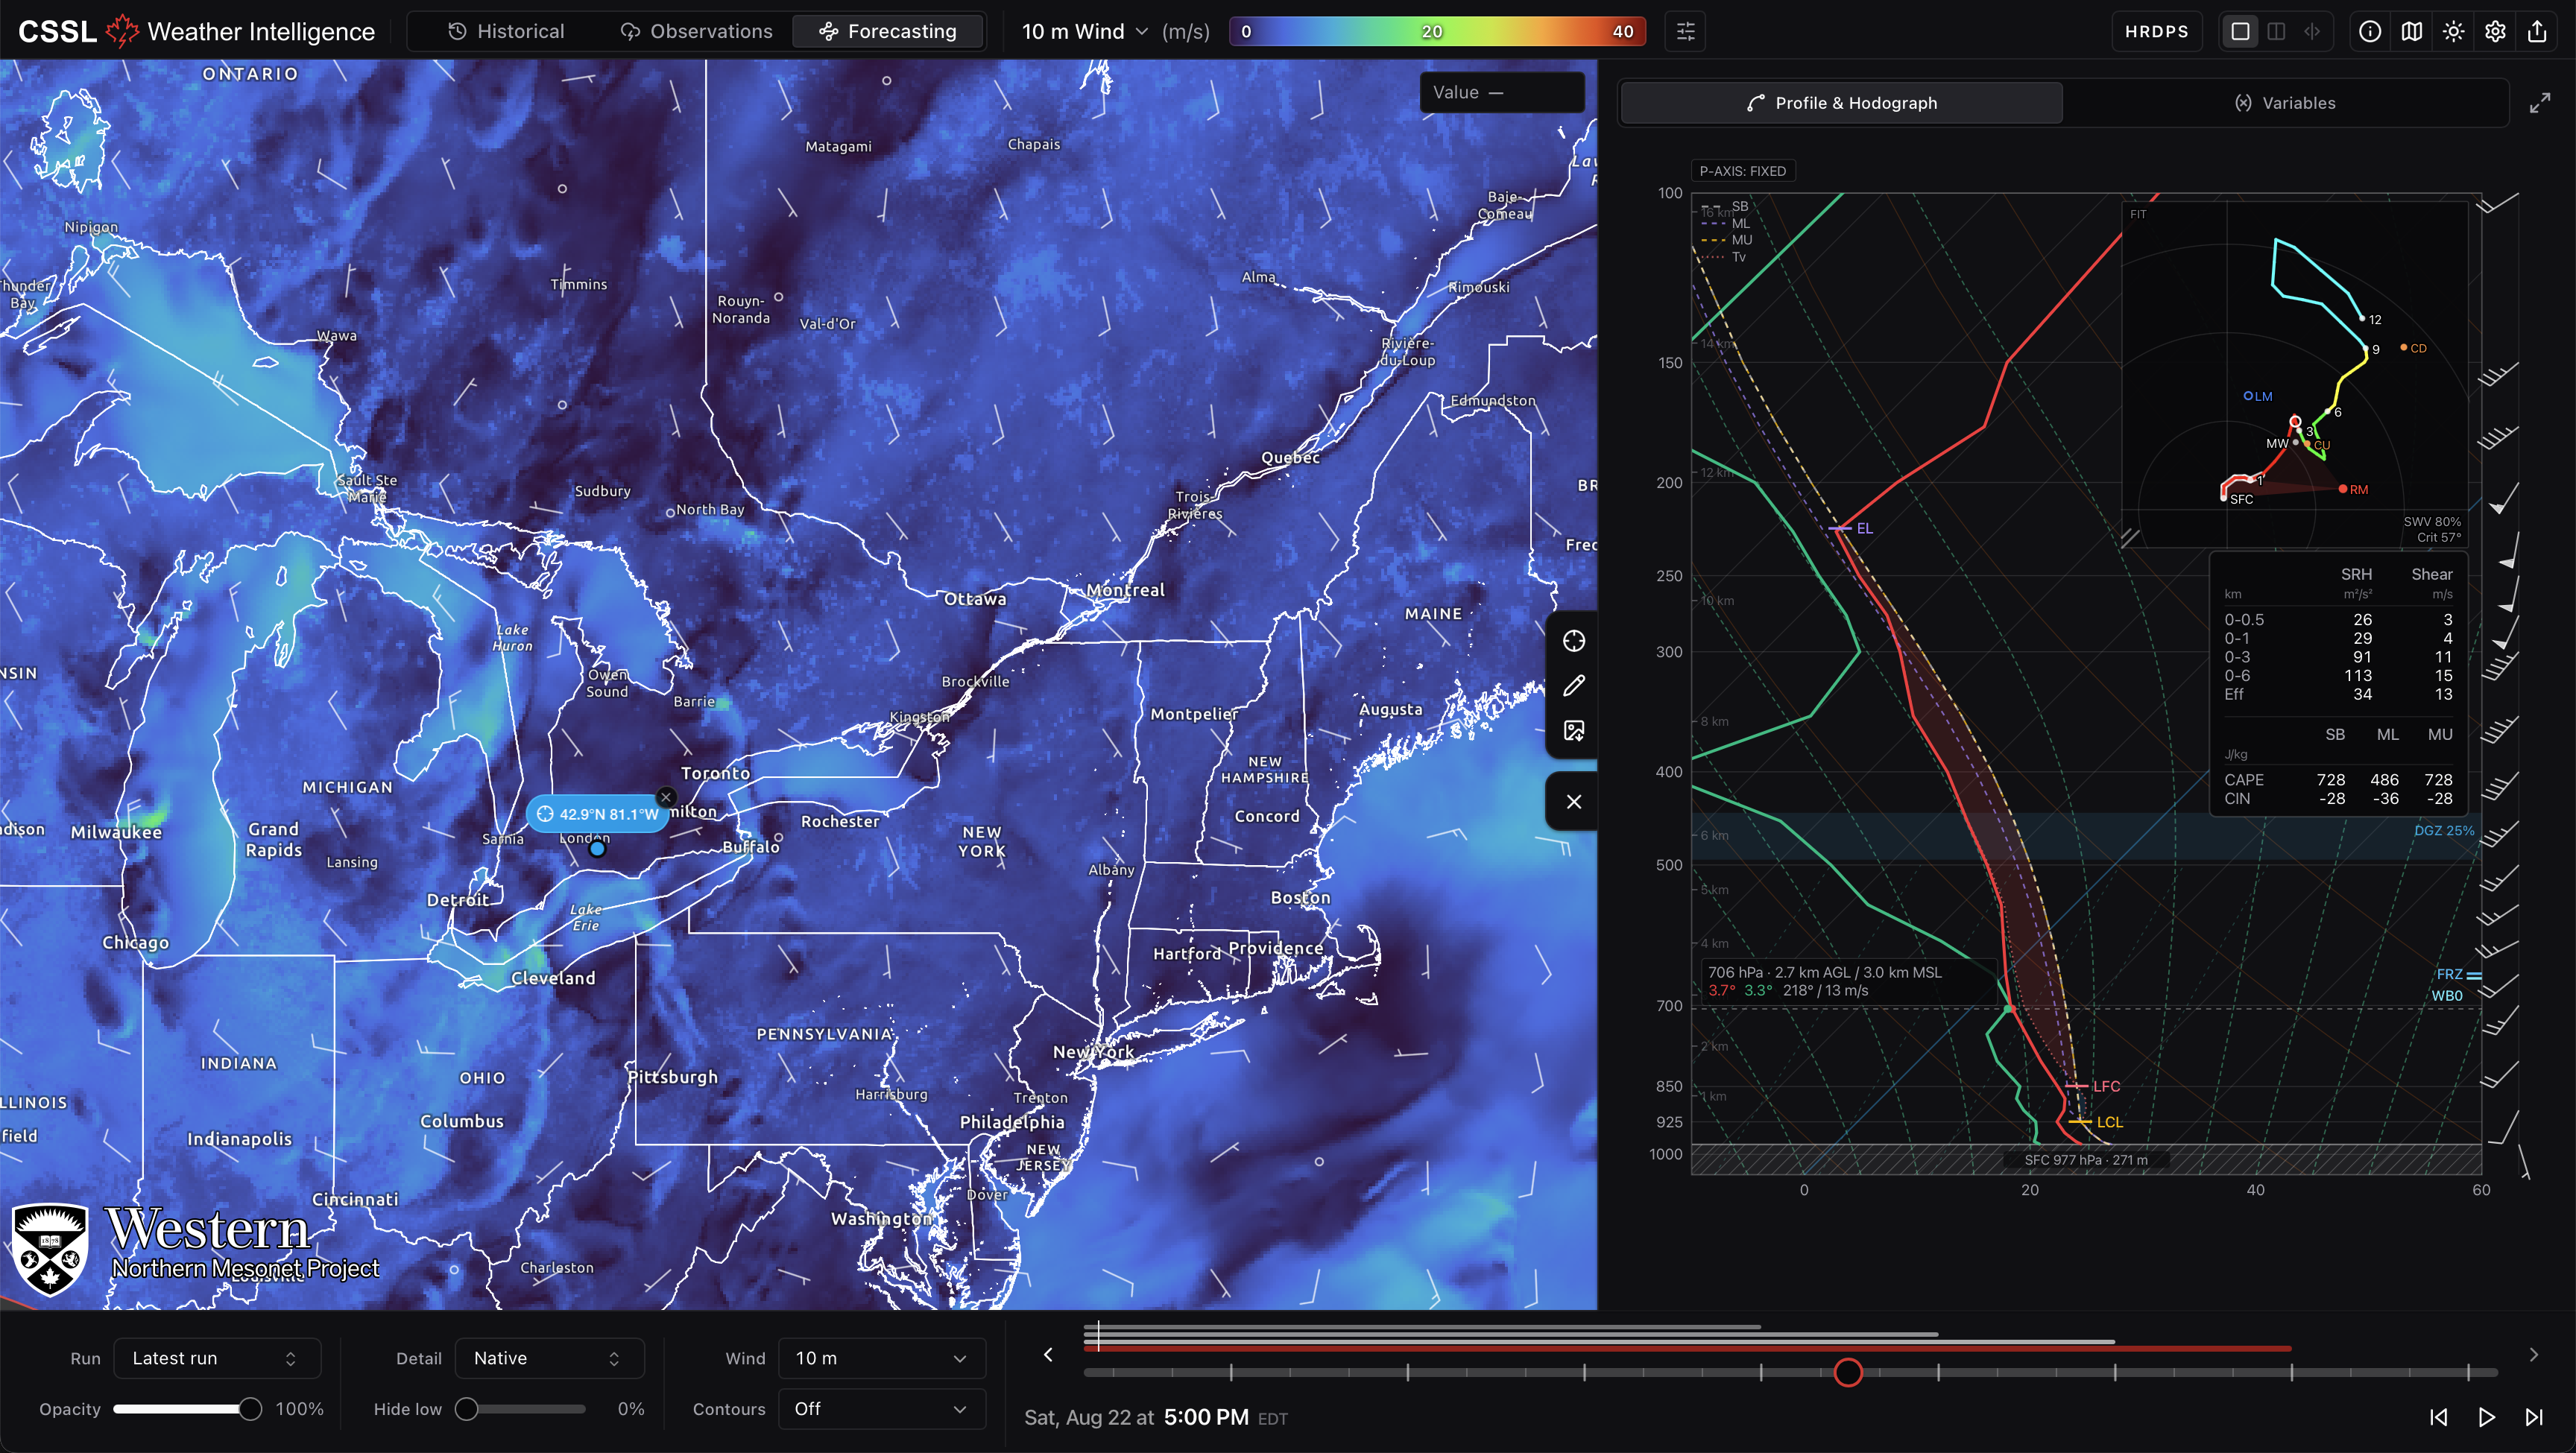
Key Features:
- Explore forecasts from HRDPS, HRRR, RDPS, GFS, and ICON, providing a range of regional and global model guidance across Canada and beyond.
- Access a wide range of native model parameters, as well as storm-related parameters calculated by CSSL to support severe weather analysis and forecasting.
- Select individual model runs and move through the forecast period using the interactive timeline. Arrow-key controls also allow for rapid navigation through forecast hours.
- Adjust forecast layer opacity and low-threshold cutoffs to make it easier to compare forecast fields with other information and identify areas of interest.
- Customize the appearance of forecast fields using custom colourmaps, allowing users to tailor the visualization of different meteorological variables.
- Plot wind barbs and contours directly on forecast fields, with adjustable contour density for improved visualization of atmospheric structure.
- Explore atmospheric profiles using soundings and hodographs, available at individual points or across user-defined boxes. These tools allow users to examine the vertical structure of the atmosphere and assess environments supportive of severe weather.
- Create and annotate custom forecast areas using the forecast creator and drawing tools, allowing users to highlight areas of interest directly on the map.
- Compare forecast guidance from multiple models and runs within the same interface, making it easier to identify areas of model agreement and uncertainty.
- View forecast data alongside real-time observations, radar, satellite, lightning, and other weather information, allowing users to compare what was forecast with what is actually occurring.
- Export forecast animations as GIFs, providing a simple way to share the evolution of forecast conditions over time.