NTP's new Advanced Dashboard released
The NTP has created an Advanced Dashboard for viewing and analyzing historical Canadian tornado data, and at the end of this blog post we provide instructions on how to create an account to use it.
NTP blog posts over the last two days have described new and revised historical Canadian tornado data sets - a revised 1980-2009 30-year data set and a new 1991-2020 30-year data set. The Advanced Dashboard will allow filtering and plotting of the tornadoes in these data sets, plus NTP tornado data from 2021 to 2023 (progress toward the next 30-year data set).
The NTP already has a event dashboard on its website (here), so why was an 'advanced' dashboard needed?
First, we wanted to keep the main dashboard simple and provide another dashboard for more advanced users that really want to dive into the details and be able to slide and dice the data as they see fit. Second, the new dashboard will provide access to historical data - currently going back to 1980 but in the future going back to Canada's very first documented tornado in 1792. We wanted the main dashboard to continue to be focused on just the NTP era beginning in 2017.
So what's new about the new Advanced Dashboard? Plenty:
- for the first time, tornado tracks can be plotted (where they have been documented - see map below)
- for complex, non-linear tracks, we have started to add tracks with enhanced detail (more will be coming)
- more event details, including commentary, have been added
- event revisions have been documented in the comments, including who made the revisions (whether it be researchers at Environment Canada or the NTP itself)
- more data filters have been made available, including by month, time of day, length, width, tornado motion, losses and more.
There are a few important notes regarding the way in which the Advanced Dashboard works:
- to maintain consistency with the historical data, only 'Tornadoes (over land)' are included; that includes tornadoes over bodies of water < 10,000 sq km (which excludes large lakes and oceans)
- for tornado tracks that cross the US border, only the part of the track in Canada is fully documented though details from the US side are included in the commentary
- for tornado tracks that cross internal borders in Canada (e.g., from one province to another), tracks are broken into two segments so that provincial statistics could be calculated; so when choosing 'All of Canada', these segments are counted as one tornado, and when choosing a province or territory, only the segments are added to the counts
- the new dashboard is currently best viewed using a laptop or desktop; a mobile version will be developed in the future
- unlike NTP's main dashboard, the Advanced Dashboard will only be updated periodically - perhaps once or twice per year
- while access to the dashboard will be free and open, you'll need to create an account to use it; instructions are included below
- for now, the ability to download the data is turned off; that will change in the near future.
The blog posts over the last couple of days have shown multiple examples of what the new Advanced Dashboard looks like and can do. Please create an account and have a good look around yourself. We'd appreciate your feedback. And if you encounter any errors or typos, please bring that to our attention as well. Please be patient as we process all of the requests for access. Lastly, please spread the word - we'd like to see the new data sets and dashboard used as much as possible by as many as possible.
Acknowledgments
There have been a number of contributors to the new Advanced Dashboard, but the key personnel involved were Liz Sutherland, Jordan Fuller, Maia Somers, Lesley Elliott, Francis Lavigne-Theriault, Aaron Jaffe and David Sills. And thanks to ImpactWX for the support of this project.
Instructions for creating an account:
- Navigate to the Western University Hub Community Page
- Select 'Sign-in' from the top right hand corner
- Select 'Create a Western University Hub Community Account
- Once you've created your account, email ntpmedia@uwo.ca with your username to request to be invited into the NTP Advanced Dashboard Group
- You'll be added as soon as possible and will be able to access the Dashboard here.
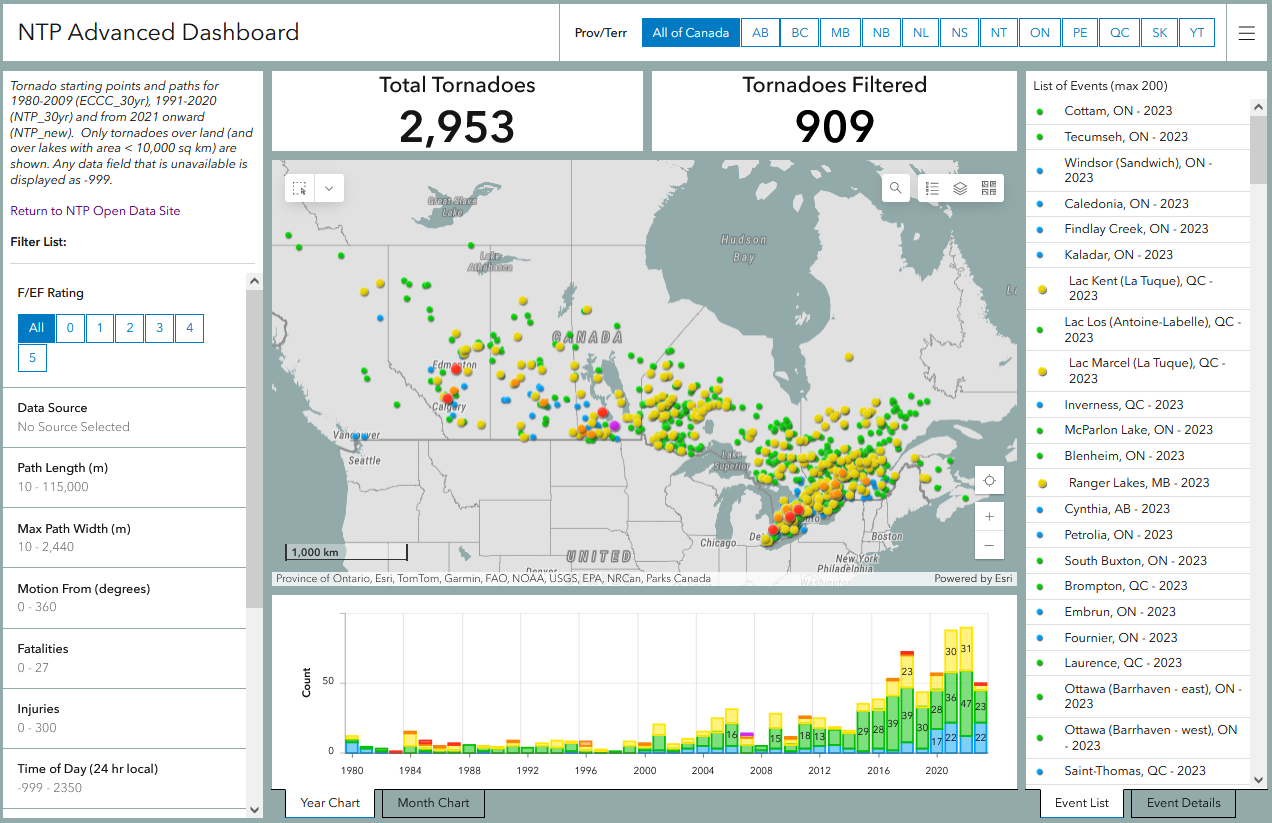
Advanced Dashboard map showing the 909 events across Canada between 1980 and 2023 with path data.