A new 1991-2020 Canadian tornado database
The NTP has created a new 1991-2020 Canadian tornado database from which a new 30-year climatology derives. The new climatology includes four years from the NTP era (2017 through 2020) and can be compared to the previous 30-year climatology (1980-2009) that was revised by NTP and discussed in yesterday's blog post.
The years 1991 through 2009 are shared with the previous database and 30-year climatology, but the 2010 through 2016 data entries had to be created from scratch. Records from ECCC forecast offices formed the basis of this new event documentation but, as mentioned previously, NTP also added many new records and revisited significant events - with historical satellite imagery being a key resource.
And of course, the NTP data set that has been available through our main dashboard (here) includes tornadoes from 2017 to 2020, and these also make up part of the new database and climatology.
So let's have a look at some of the totals, averages and extremes from the new climatology and how they compare to the previous climatology.
The new data set has a total of 1939 tornadoes, which is just 10 shy of the total for the 1980-2009 data set. However, the number of tornadoes rated F/EF2 or higher has increased from 207 to 228, with the annual frequency increasing from 6.9 to 7.6. So, just slightly less tornadoes overall, but more significant tornadoes.
A good news story from the new data set is that the number of fatalities and injuries has decreased substantially, with fatalities dropping from 2.1 per year to 0.8 per year and injuries falling from 30.9 per year to 11.4 per year. This is likely influenced by gradual improvements in severe storm detection and prediction. And it's also possible that Canadians are more aware of the risk posed by tornadoes and what actions to take if one is about to hit.
On the other hand, the average annual losses due to damage have increased substantially, from $25.4M per year to $33.4M per year. These loss figures have not been adjusted for inflation, however, so the difference may not be as significant as it appears.
The average path length (overall and F/EF2+) has decreased with the new data set, going from 10.6 km / 19.7 km to 8.6 km / 16.2 km, while the average width at the damage path's widest point (overall and F/EF2+) has increased, going from 348 m / 582 m to 354 m / 667 m. This is most likely because some historical tornadoes with long paths were able to be split into smaller paths based on historical satellite imagery. Widths have most likely increased because the full extent of damage is often better seen using satellite imagery, particularly in forested areas - evidence that was not available for much of the 1980-2009 period.
Interestingly, the province with the highest tornado frequency has changed with the new data set. For the 1980-2009 period, it was Saskatchewan with the clear lead at 17.4 tornadoes per year. Ontario now leads Canada with 18.2 tornadoes per year over the 1991-2020 period. With the new data set, Saskatchewan comes in a distant second with an average of 14.6 tornadoes per year.
Moving to extremes, the most intense tornado and most prolific one-day outbreak remain the same - the 2007 Elie, MB F5 and the 20-Aug-2009 outbreak in southern Ontario, respectively. The earliest tornado also remains the same - the Pitt Meadows, BC F0 tornado of 1991.
However, there are some new extremes in the 1991-2020 data set. The longest path during that period at 98,300 m belongs to the 27 Aug 1991 Mastigouche, QC F2 tornado. The widest path - at 2,440 m - goes to the Brooks Lake, ON F2 tornado of 8 Jun 2020. And the tornado recorded latest in the year is the 23 Nov 2013 Charleville, ON EF1.
There is a journal paper in preparation that will compare the two 30-year climatologies in more detail.
Below are the main significant event revisions made by the NTP for the 2000-2016 period (the 1980-1999 period was discussed in yesterday's blog post):
- the 2006 Argyle, NB F1 tornado was upgraded to F2 based on new evidence, and historical satellite imagery also led to the discovery of an even larger F2 track from the same day just to the east, at Nashwaak Lake
- a 2006 Connaught, ON to Shawville, QC F2 tornado was removed since historical satellite imagery showed that damage in the area was widespread and due to one or more downbursts rather than a tornado
- thorough analysis of historical satellite imagery for the 2 Aug 2006 tornado outbreak in southern ON led to a number of upgrades and merged tornadoes, plus some significant width and length changes
- similar analysis of historical satellite imagery for the 20 Aug 2009 tornado outbreak in ON led to the discovery of two new tornadoes, resulted in upgrades to F1 and F2 ratings in some cases, and led to the Kennisis Lake tornado being split into two distinct tornadoes
- regarding the Harrow- and Leamington-area tornadoes of 6 Jun 2010, a reanalysis based on new evidence and historical satellite imagery led to a number of major length and width changes, as well as rating upgrades
- the 2015 Tilston, MB tornado was re-analyzed and the track revised
- several weak tornado events based on 2nd-hand reports were removed (Blue Ridge, AB 2000; Acme, AB 2001; Webb, SK 2001; Standard, AB 2007; Listowel, ON 2007)
Changes made to events are described in the 'Comments' column for those events.
Users will be able to view and plot tornadoes from this new data set using the Advanced Dashboard being released on Friday (tomorrow!). Some sample images from the 1991-2020 data set plotted using the Advanced Dashboard are provided below.
Acknowledgements
There have been a number of contributors to the new 1991-2020 data set, but the key personnel involved were Joanne Kunkel, Lesley Elliott, Francis Lavigne-Theriault, Liz Sutherland, Jordan Fuller, Maia Somers and David Sills. And thanks to ImpactWX for the support of this project.
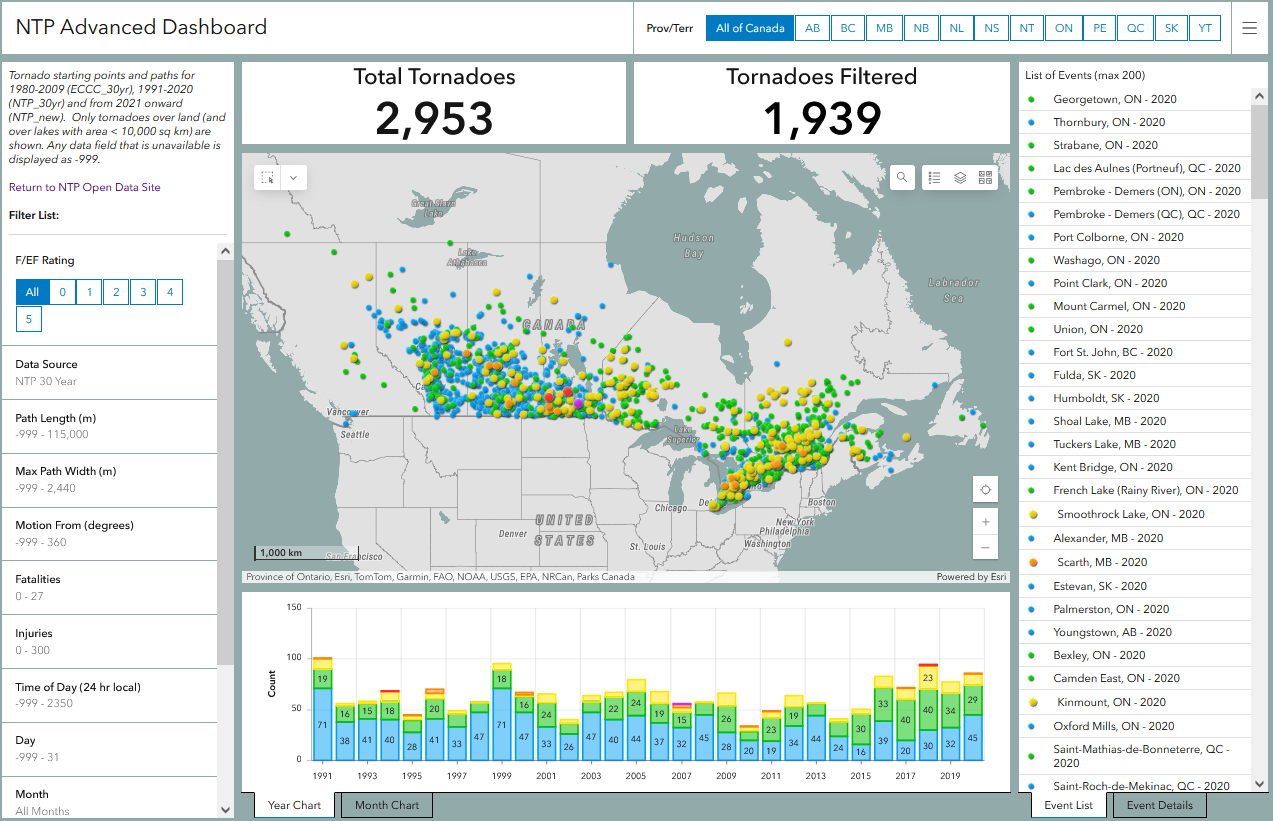
All 1939 tornadoes from the 1991-2020 data set (called NTP_30yr) with annual count chart below.
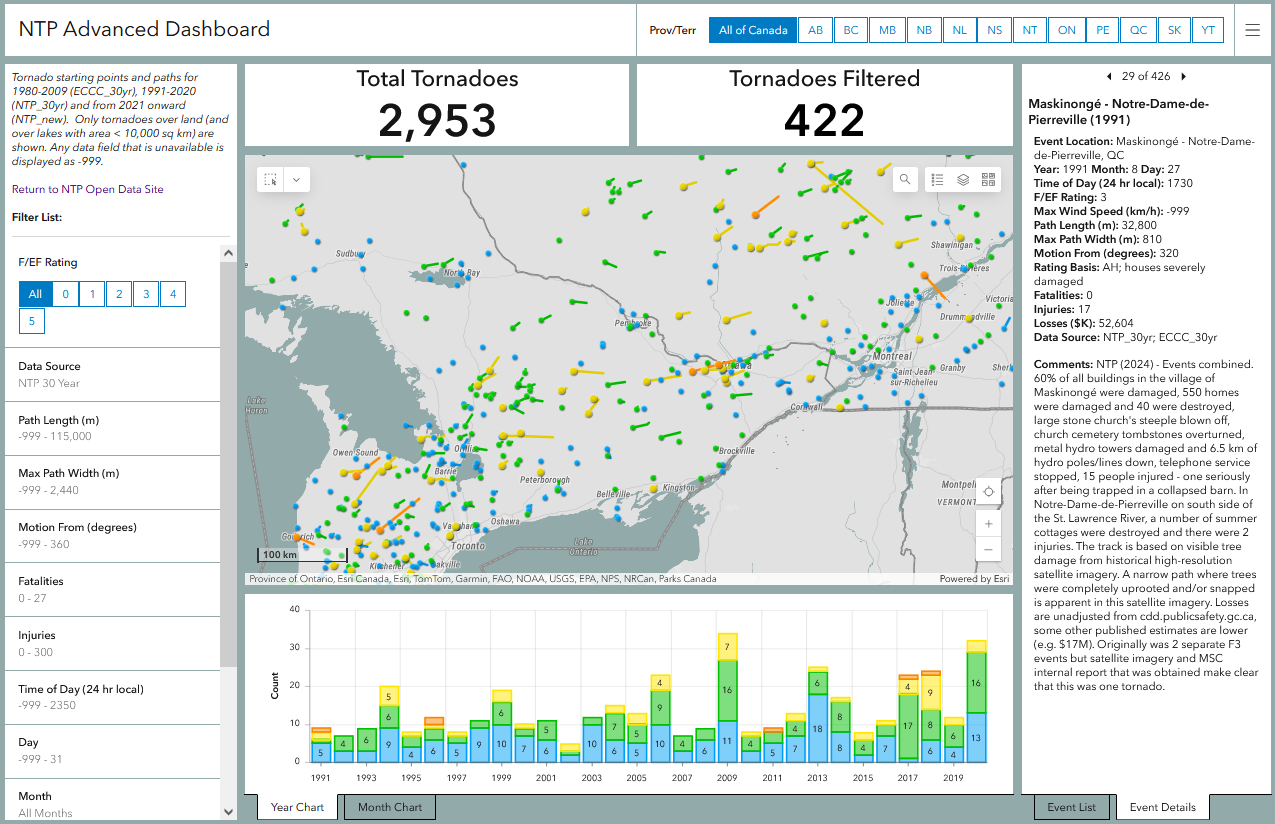
Map showing 422 tornadoes across parts of eastern Canada from the 1991-2020 data set with annual count chart below.
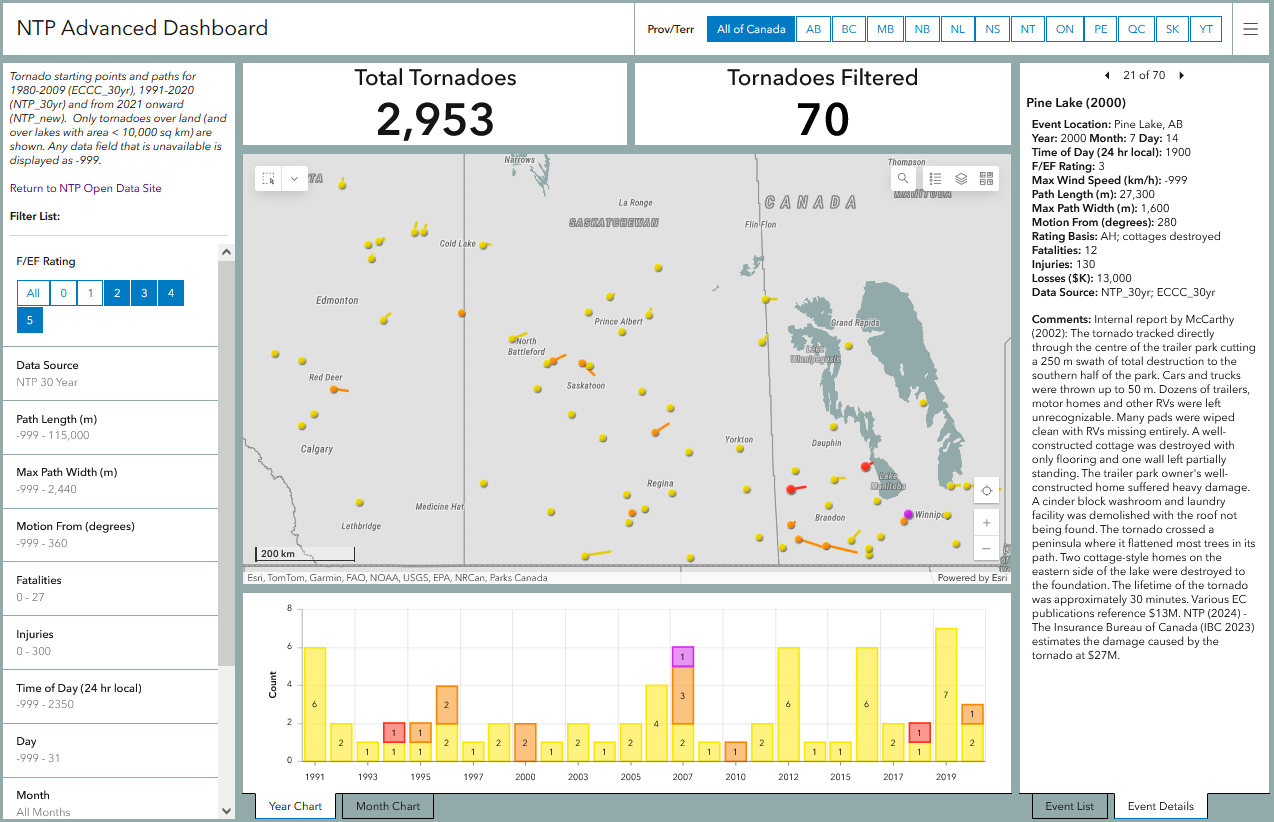
Map showing F/EF2+ Prairie tornadoes from the 1991-2020 data set with monthly totals chart below
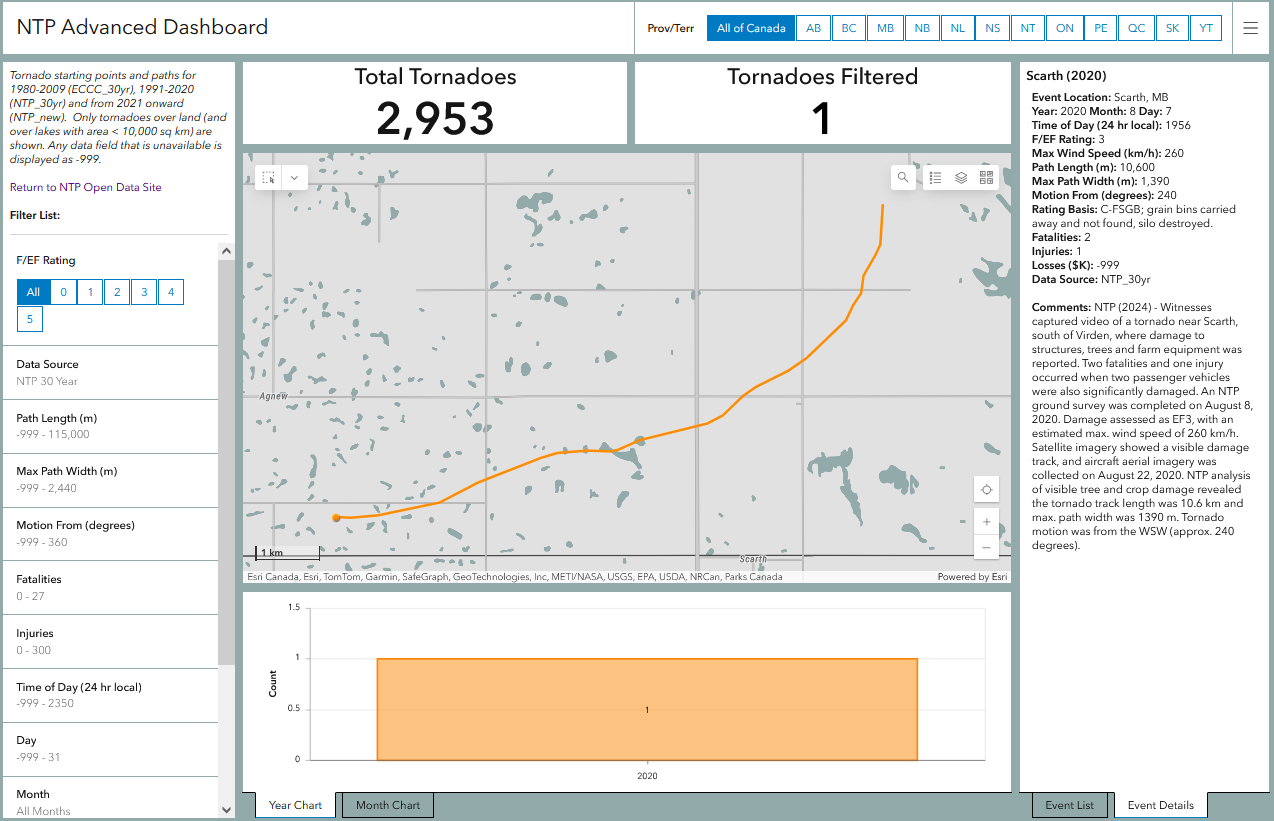
Zoomed map of the 2020 Scarth, MB EF3 tornado showing the enhanced track detail. A number of tornadoes with non-linear damage paths have this enhanced track detail and more will be added later.