Tornadoes and downbursts in SW ON on July 20
NTP investigations have concluded that the storms that affected southwestern Ontario on Thursday July 20th produced 2 tornadoes and 4 microbursts. An NTP survey team investigated reported damage in the South Buxton and Petrolia areas and found evidence for a tornado in each location, rated EF1 and EF0 respectively. A second NTP survey team investigated reported damage at Sarnia, Wardsville and Wilkesport and determined an EF0 downburst caused the damage in each case. A third NTP survey team investigated damage at Alvinston and an EF0 downburst was determined to have occurred there.
More details are provided in the summaries below, followed by maps and photos. Event information can also be viewed and plotted via the NTP Dashboard at https://uwo.ca/ntp/dashboard.
====
Event Name: South Buxton, ON
Date: July 20, 2023
Start Time: 4:50 PM EDT (2050 UTC)
Final Classification: Tornado (over land)
Final EF-Scale Rating: EF1
EF-Scale Damage Indicator / Degree of Damage: FR12/DOD-4
Start of damage track: 42.2915N, 82.1855W
End of damage track: 42.2551N, 82.0713W
Location of worst damage: 42.2751N, 82.1071W
Description: Roof damage to a home and tree damage was reported in the Dealtown area after a storm passed through. No injuries were reported. An NTP ground and drone survey was completed on July 21, 2023, documenting damage to roof damage to the home along with minor roof damage to several other homes and barns and damage to crops and trees along a path that started northeast of South Buxton. Damage assessed as EF1 tornado, with an estimated max. wind speed of 175 km/h, track length of 10.5 km and max. path width of 850 m. Tornado motion was from the WNW (approx. 290 degrees). Satellite imagery review is pending. Start time is radar estimated.
Event Name: Petrolia, ON
Date: July 20, 2023
Start Time: 4:25 PM EDT (2025 UTC)
Final Classification: Tornado (over land)
Final EF-Scale Rating: EF0
EF-Scale Damage Indicator / Degree of Damage: C-T/DOD-3
Start of damage track: 42.8798N, 82.0240W
End of damage track: 42.8870N, 81.9905W
Location of worst damage: 42.8814N, 82.0073
Description: Damage to a barn roof was reported east of Petrolia after a storm passed through. No injuries were reported. An NTP ground and drone survey was completed on July 21, 2023, documenting the reported damage along with tree damage, damage to a power pole and some visible tornado damage in crops. Damage assessed as EF0 tornado, with an estimated max. wind speed of 115 km/h, track length of 2.91 km and max. path width of 300 m. Tornado motion was from the WSW (approx. 255 degrees). Satellite imagery review is pending. Start time is radar estimated.
Event Name: Point Edward-Sarnia, ON
Date: July 20, 2023
Start Time: 4:00 PM EDT (2000 UTC)
Final Classification: Downburst
Final EF-Scale Rating: EF0
EF-Scale Damage Indicator / Degree of Damage: FR12/DOD-2
Location of worst damage: 42.9925N, 82.3812W
Description: Tree damage was reported in Point Edward and Sarnia area after a storm passed through. Damage was also reported west of the St. Clair River in Port Huron, MI. No injuries were reported. An NTP ground and drone survey was completed in Point Edward and Sarnia on July 22, 2023, documenting the reported damage along with minor roof damage to homes. Damage on Canadian soil assessed as EF0 downburst, with an estimated max. wind speed of 125 km/h. Satellite imagery review is pending. Event time is radar estimated.
Event Name: Wardsville, ON
Date: July 20, 2023
Start Time: 4:45 PM EDT (2045 UTC)
Final Classification: Downburst (Microburst)
Final EF-Scale Rating: EF0
EF-Scale Damage Indicator / Degree of Damage: FR12/DOD-2
Location of worst damage: 42.6266N, 81.7318W
Description: Minor roof damage to a home and damage to crops and trees was reported southeast of Wardsville after a storm passed through. No injuries were reported. An NTP ground and drone survey was completed on July 22, 2023, documenting the reported damage and additional similar damage to homes, trees and crops in the area. Damage assessed as EF0 downburst (microburst), with an estimated max. wind speed of 125 km/h. Satellite imagery review is pending. Event time is radar estimated.
Event Name: Wilkesport, ON
Date: July 20, 2023
Start Time: 4:05 PM EDT (2005 UTC)
Final Classification: Downburst (Microburst)
Final EF-Scale Rating: EF0
EF-Scale Damage Indicator / Degree of Damage: SBO/DOD-6
Location of worst damage: 42.7389N, 82.3648W
Description: Damage to a large machine shed and trees was reported in the Wilkesport area (east of Sombra) after a storm passed through. No injuries were reported. An NTP ground and drone survey was completed on July 22, 2023, documenting the reported damage along with damage to another farm property. Damage assessed as EF0 downburst (microburst), with an estimated max. wind speed of 130 km/h. Satellite imagery review is pending. Event time is radar estimated.
Event Name: Alvinston, ON
Date: July 20, 2023
Start Time: 4:30 PM EDT (2030 UTC)
Final Classification: Downburst
Final EF-Scale Rating: EF0
EF-Scale Damage Indicator / Degree of Damage: C-T/DOD-3
Location of worst damage: 42.8259N, 81.8623W
Description: Tree damage and damage to a power pole and antenna was reported in the Alvinston area after a storm passed through. Damage to farm equipment, grain elevators and a construction trailer was also reported. No injuries were reported. An NTP ground survey was completed on July 20, 2023 documenting the reported damage in Alvinston. Damage assessed as EF0 downburst, with an estimated max. wind speed of 115 km/h. Satellite imagery review is pending. Event time is radar estimated.
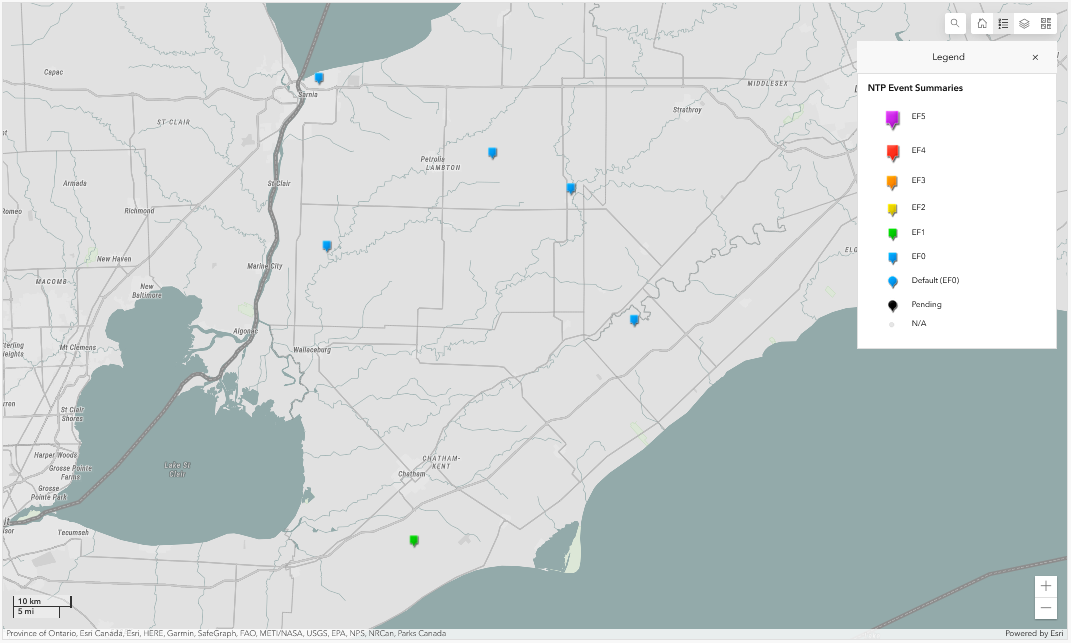
NTP Dashboard map showing the locations of all 6 events.
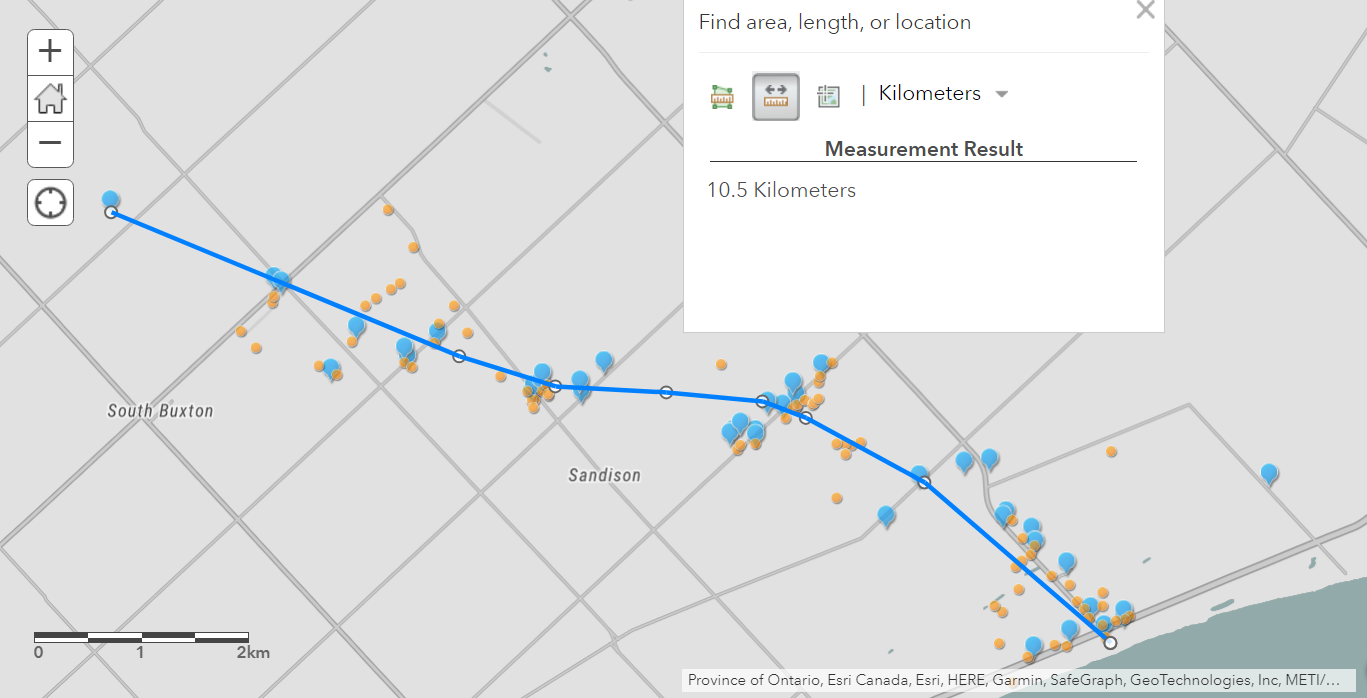
Map showing track of the South Buxton EF1 tornado toward the east-southeast, with blue pins being locations where damage was documented and orange circles being locations of drone images.
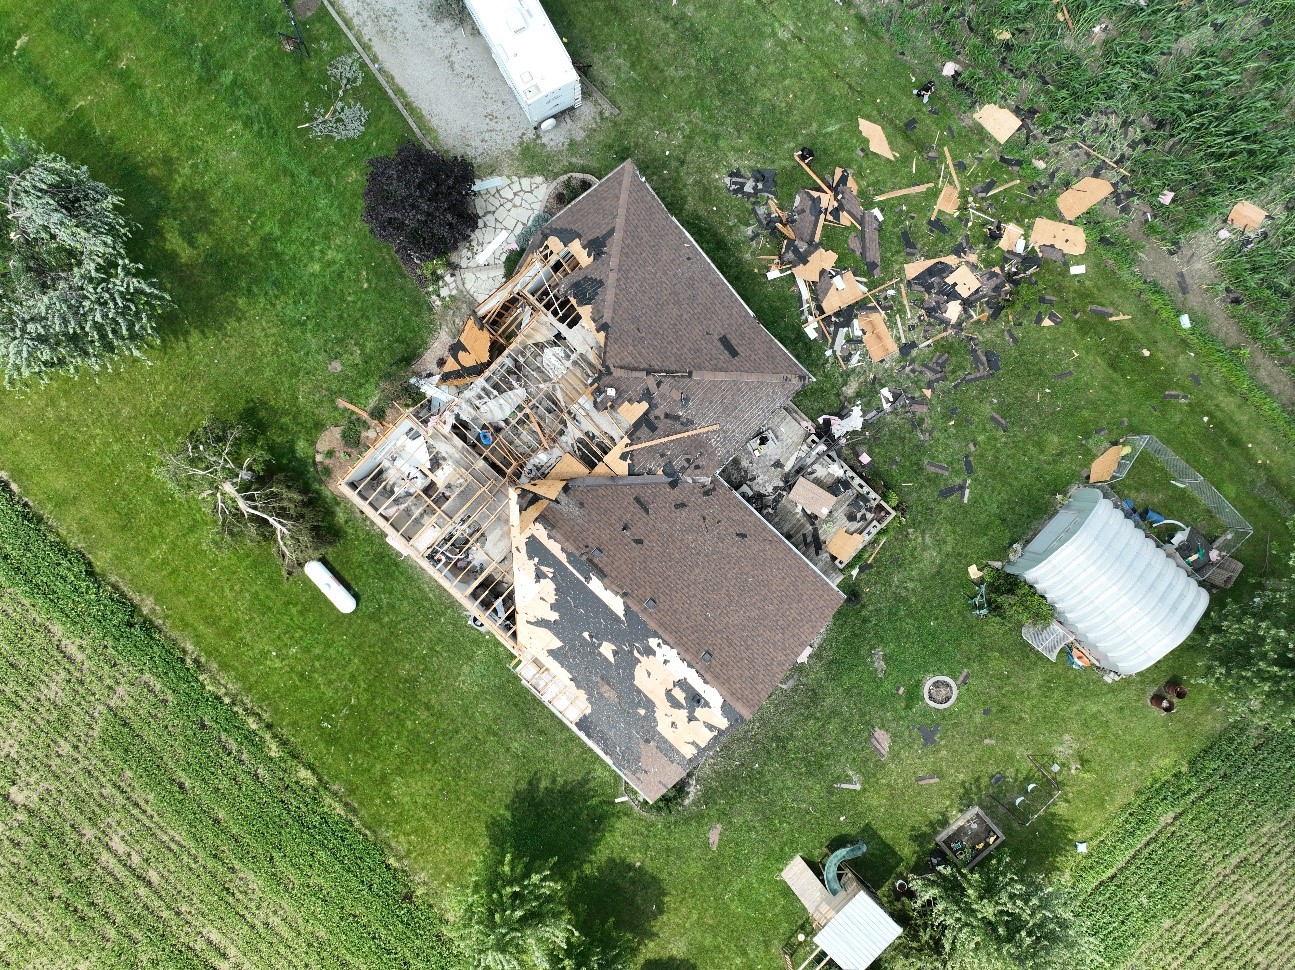
Drone image showing the worst damage along the South Buxton EF1 tornado track, with house experiencing more than 20% roof structure loss.
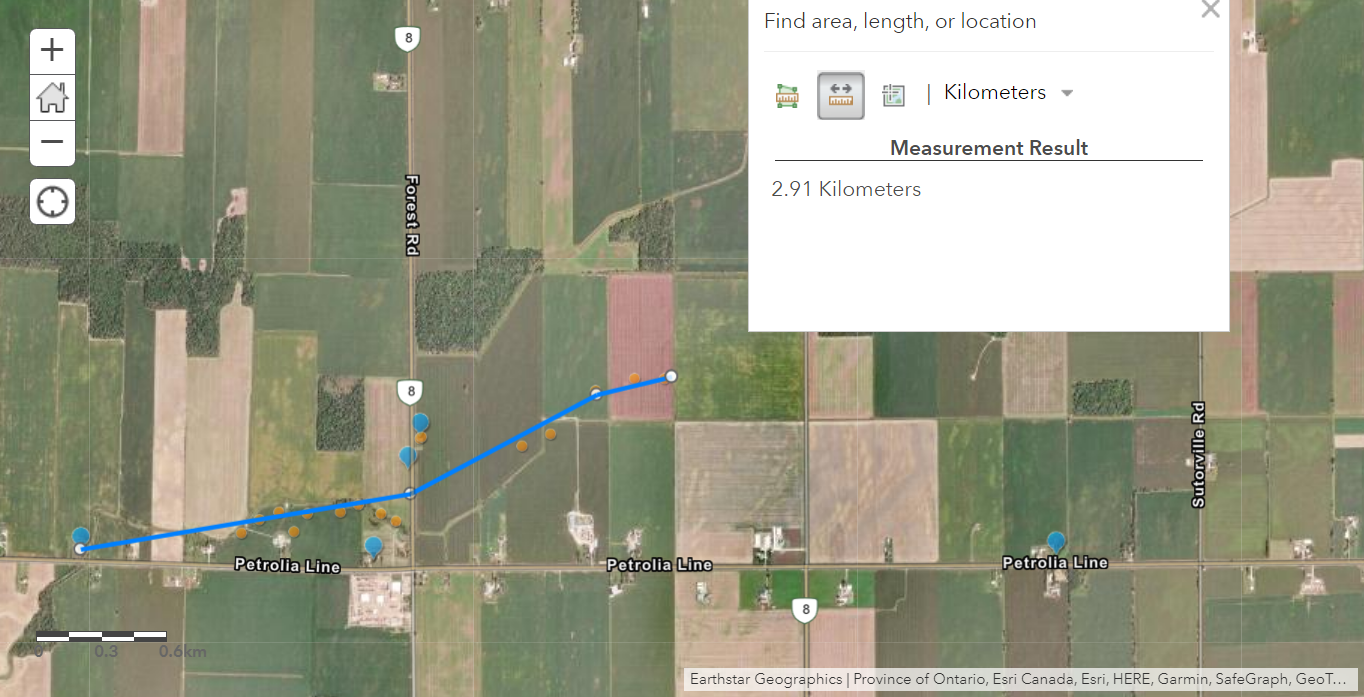
Map showing track of the Petrolia EF0 tornado toward the east-northeast, with blue pins being locations where damage was documented and orange circles being locations of drone images.
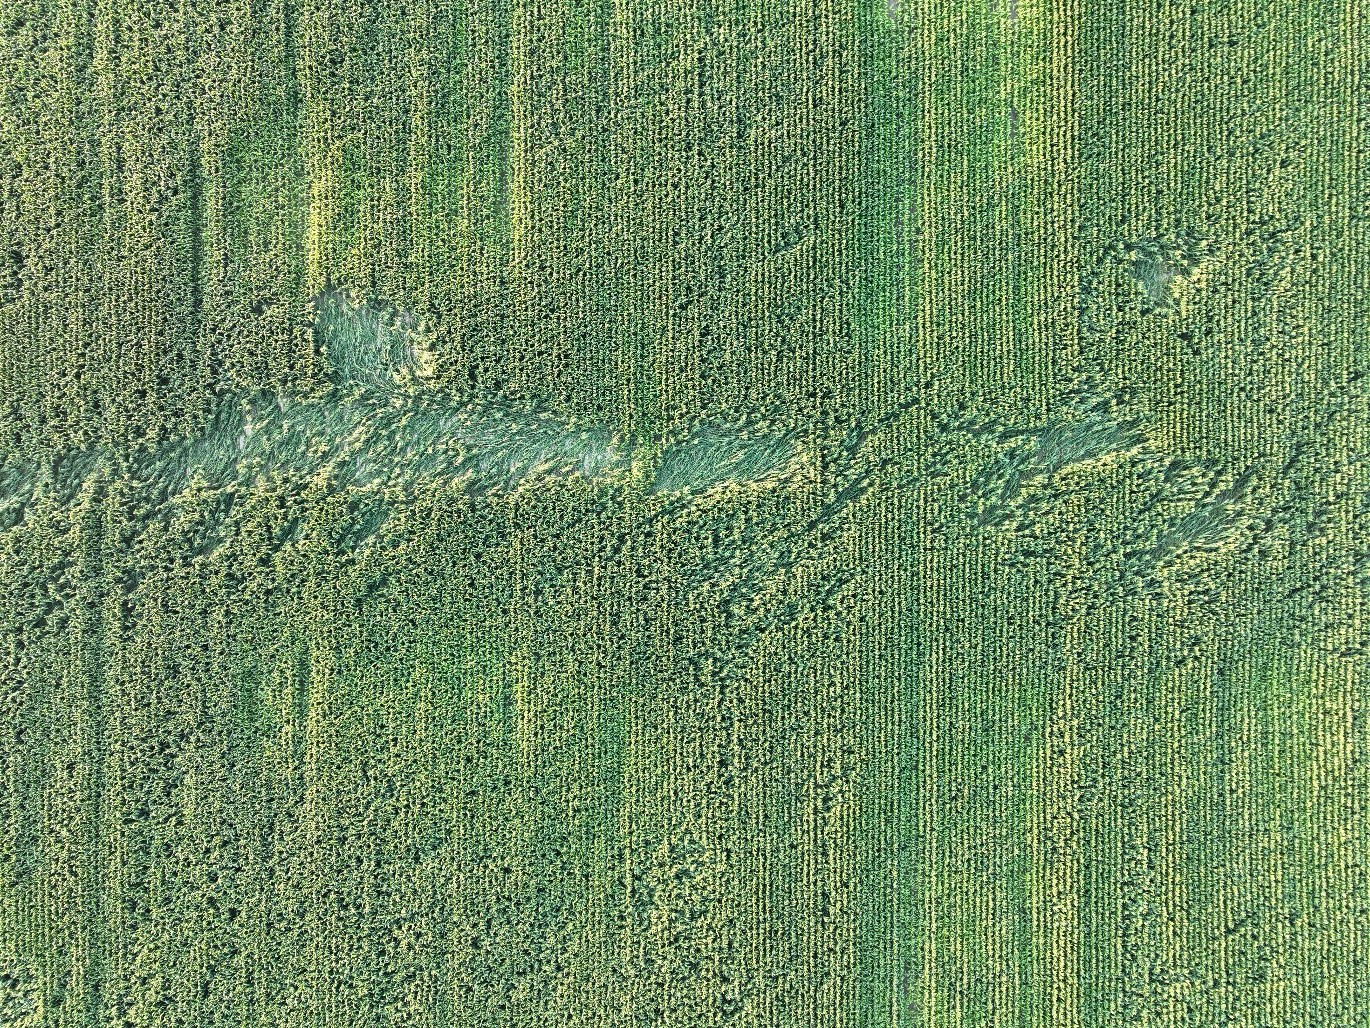
Path of the Petrolia EF0 tornado through crops.
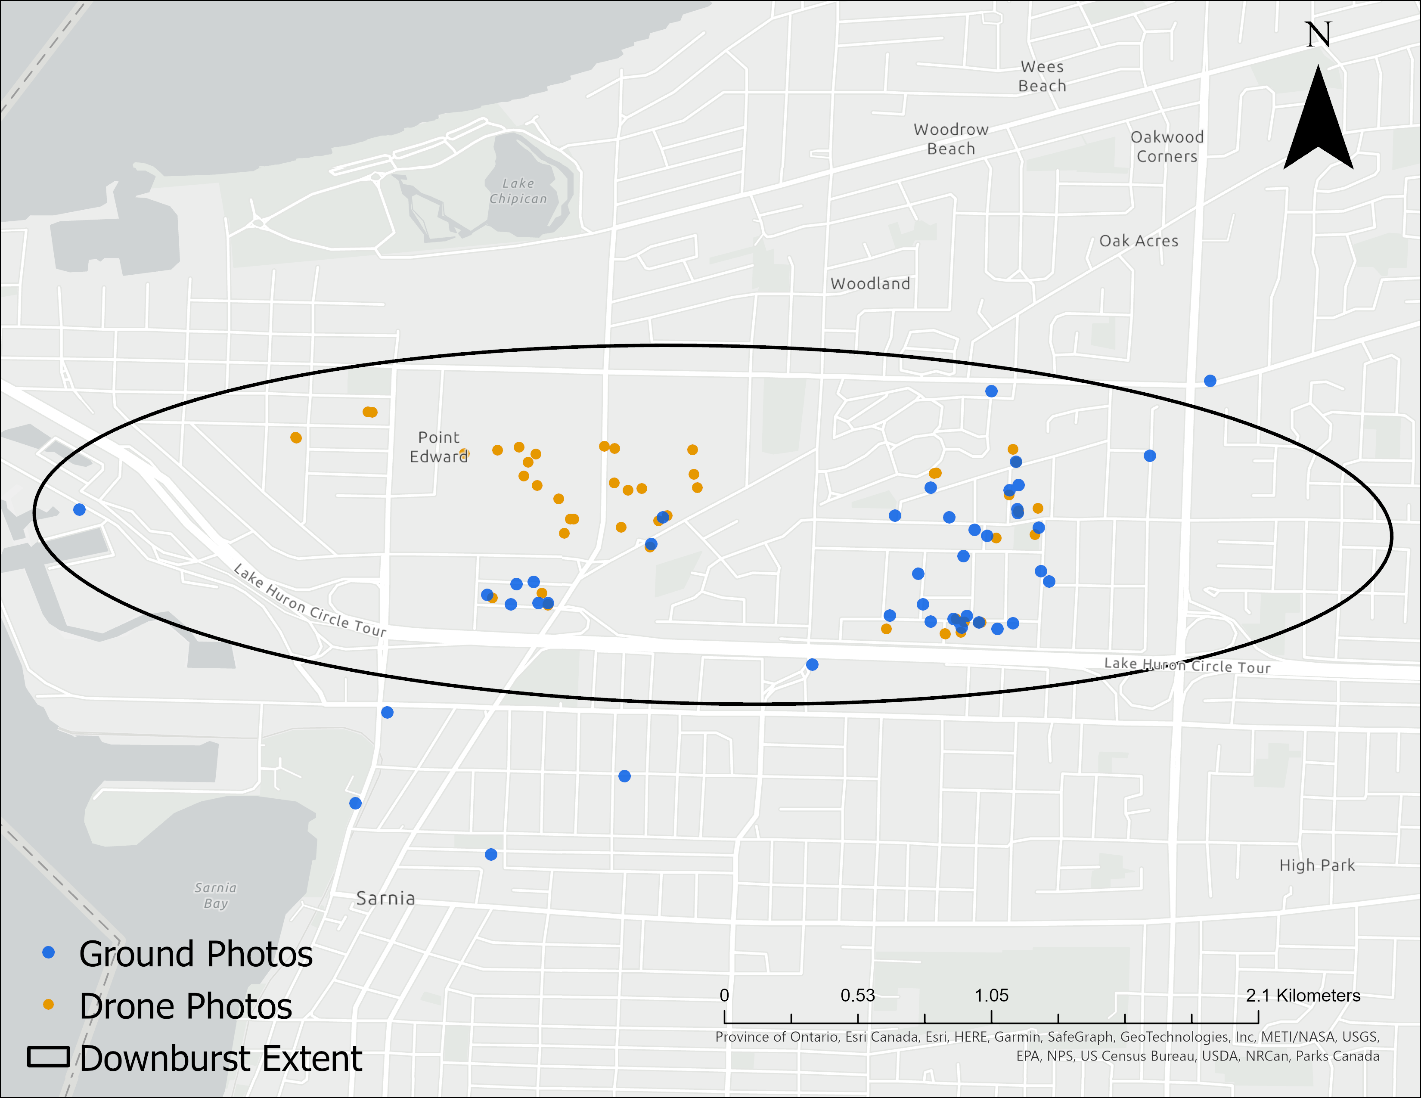
Map of widespread tree damage and light roof damage caused by the Sarnia downburst.
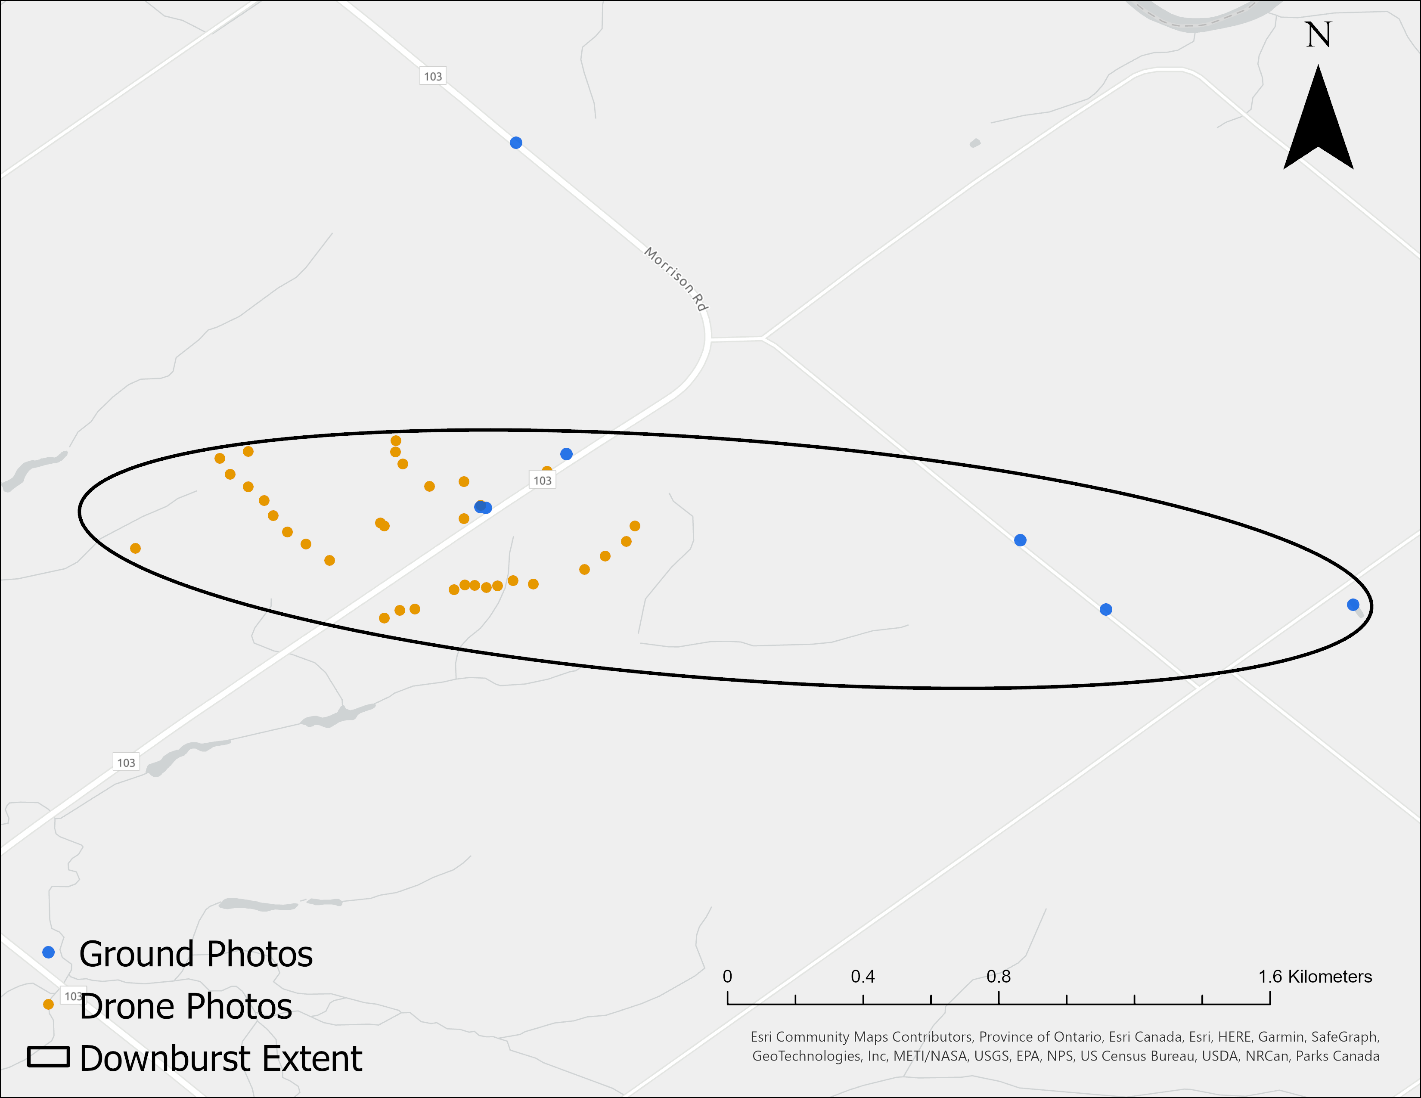
Map of tree, house and crop damage caused by the Wardsville downburst.
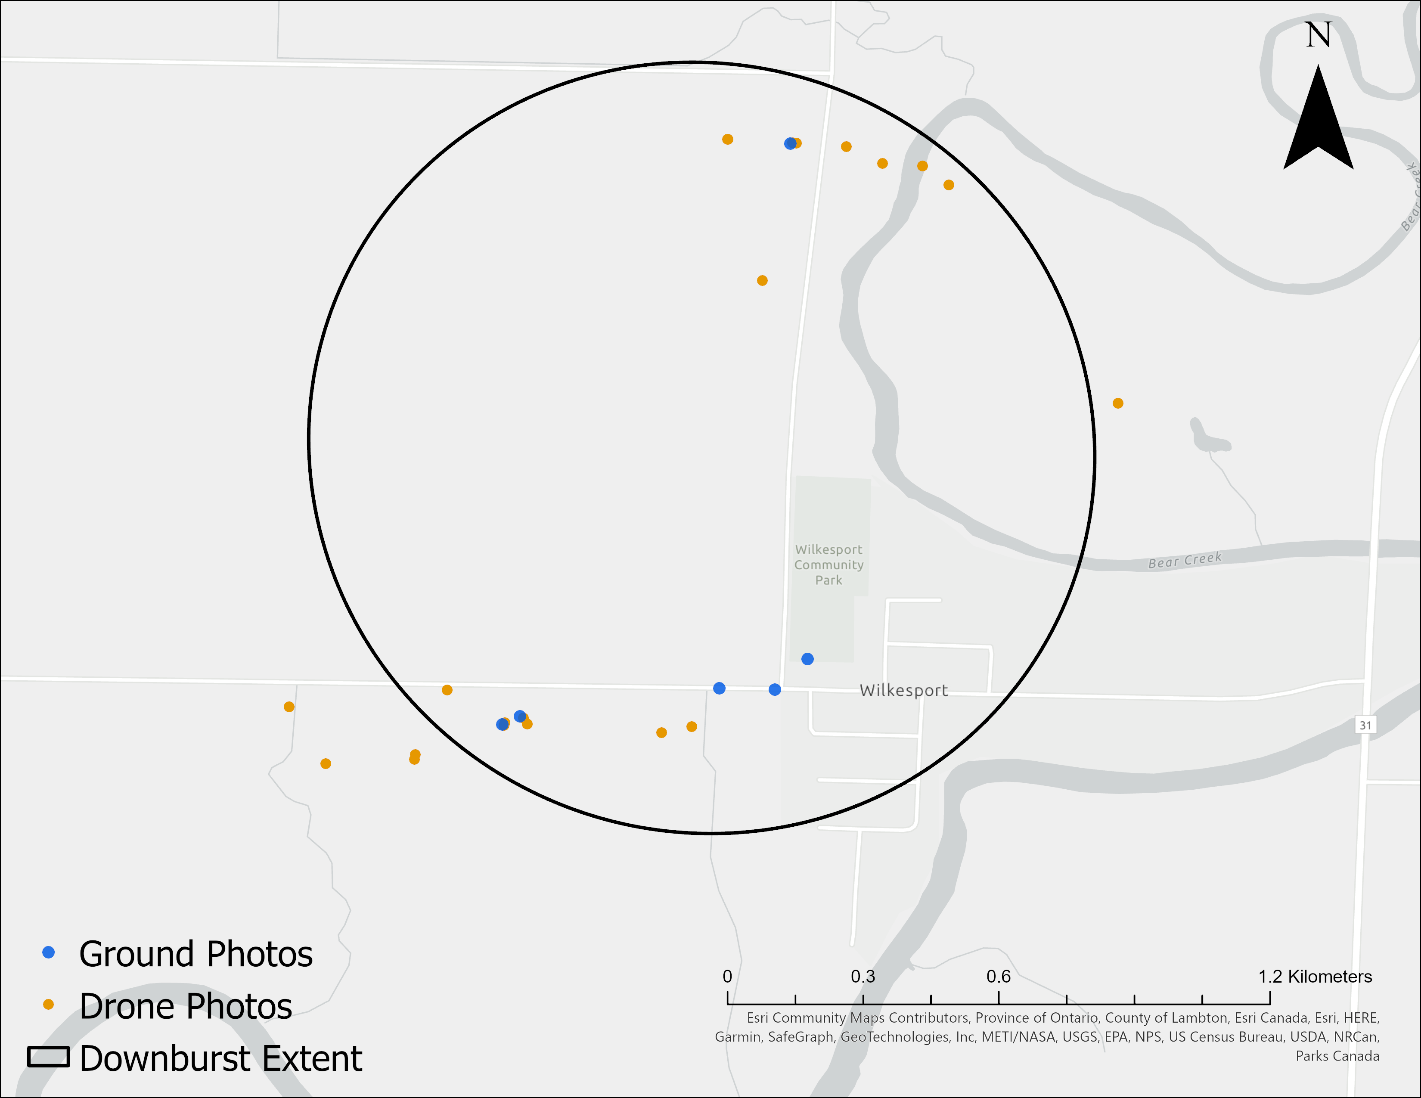
Map of tree and outbuilding damage caused by the Wilkesport downburst.
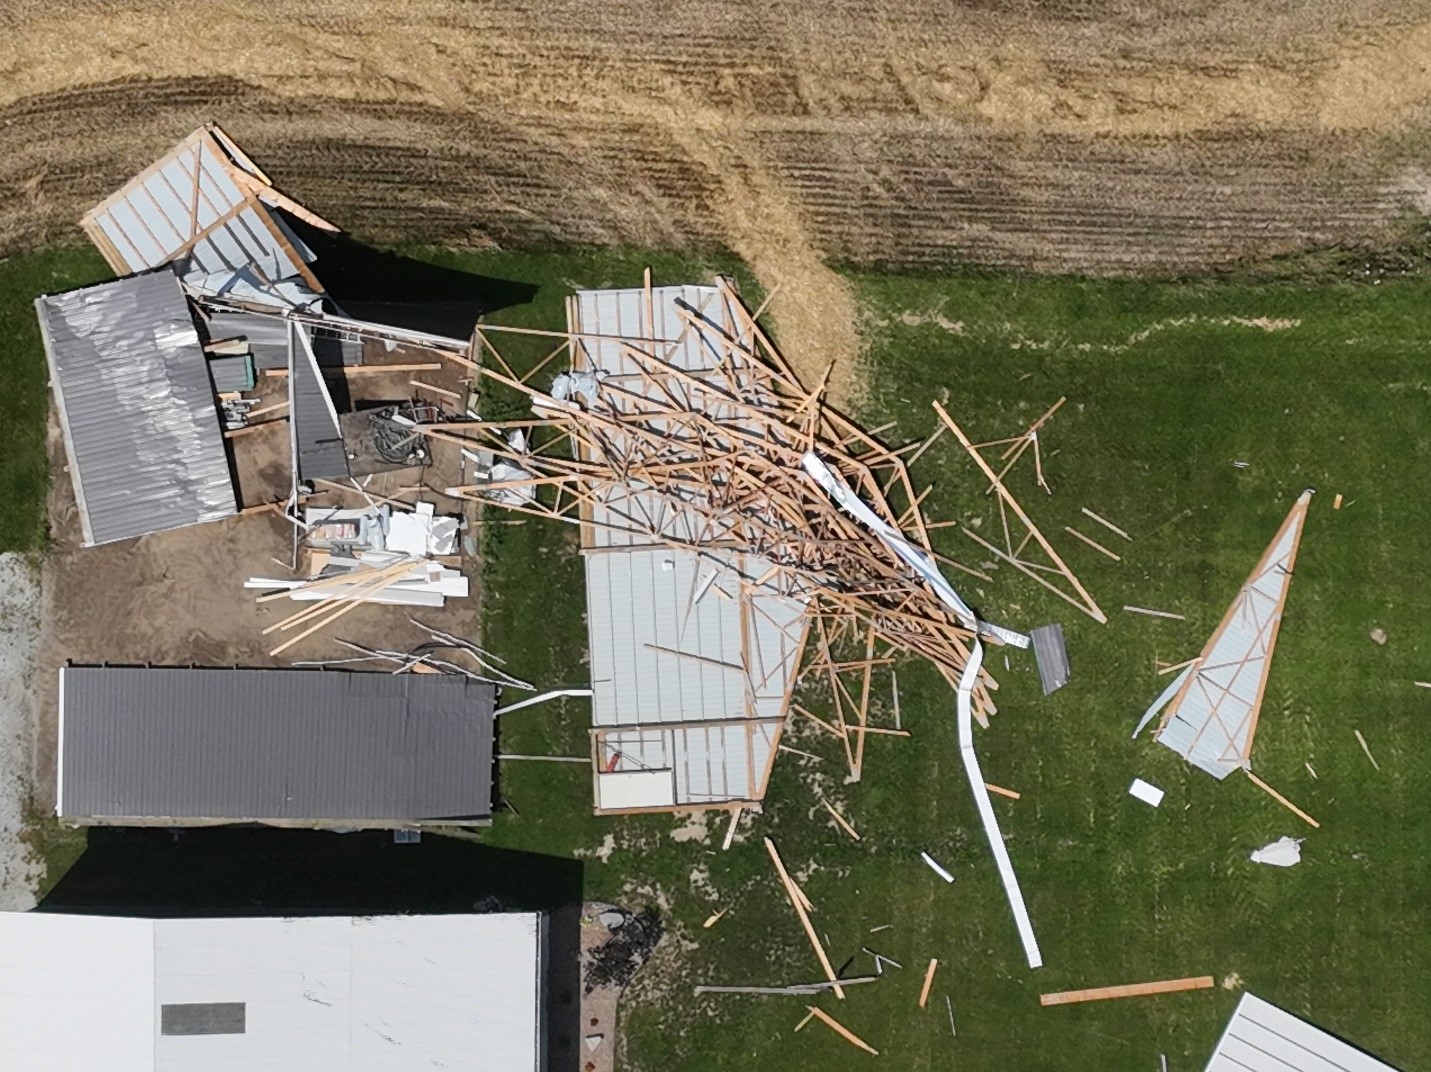
Drone image showing the worst damage with the Wilkesport EF0 downburst, with outbuilding losing its roof and two walls (difficult to see but two walls are still standing here). The west-facing door to this machine shop may have been open during the storm.