PRESERVING CANADA’S MOST BEAUTIFUL CAMPUS
A Discussion Paper on New Construction and the Campus Core at Western, 2000 to 2020
March 2000
Dr. Paul Davenport
President
The University of Western Ontario
On February 24, 2000, Minister Dianne Cunningham came to Western to announce that the Province would provide $40.5 million in funding for the University's Accessibility and Quality SuperBuild project. The project will involve new construction of some 33,500 gross square meters on our campus and will prepare the University to receive the growing student demand produced by the Double Cohort and baby boom echo. As we plan the siting of the SuperBuild construction, we require a clear idea of our longer term plans for campus development. In what follows we set out some ideas on the latter issue and relate them to the Campus Master Plan approved in 1995.
This is a discussion paper and comments are most welcome. In particular, I must stress, as our 1995 Campus Master Plan did, that any building sitings, or absence thereof, in this paper are strictly illustrative, and do not represent University policy or commitments. Those who argue at some later date that this or that University initiative is improper because of a passage in this paper will find no sympathy with the author. This spring Western will engage in a public consultation with regard to our options for future campus development; this paper will provide some background to that process.
As the title of our SuperBuild project indicates, Western's main concern over the coming years will be to find the right balance between growth in accessibility and high quality in learning and research. That balance will depend on many factors, including future decisions by both senior levels of government on public funding for university teaching and research. Our Senate and Board have been grappling with the accessibility and quality issue for years, and will continue to do so in the future.
Many in our community, however, appear concerned with a different issue: can we expand our University and retain the unity and beauty of our campus, which is a defining characteristic of Western. This is a question of great importance and complexity, and we do no more below than set out the major issues under a number themes:
Demographic Trends and University Enrolments in Ontario
Ontario is on the threshold of the largest increase in university enrolments since the 1960s. In a study done for the Council of Ontario Universities, PriceWaterhouseCoopers has estimated that the number of university students in the Province will increase by 88,900 over the next decade. Enrolments would increase by nearly 39%, from 230,000 in 1998-99 to 318,900 in 2010-11. The study identifies three sources for this increase:
The study estimates that to replace retirements and respond to the increased student demand, over 9,600 new faculty should be hired by 2010. It shows that the student-faculty ratio in Ontario rose from 15.0 in 1988-89 to 19.3 in 1996-97, when Ontario's ratio was 21% higher than the average of the other nine provinces. The study also documents an annual shortfall of some $300 million in research funding, when support for research infrastructure in Ontario is compared to that in the United States.2
With regard to physical infrastructure, the PriceWaterhouseCoopers study analyzes a severe shortfall in expenditures on physical capital at Ontario universities between actual spending and that required to maintain our facilities. The shortfall grows from $28 million per year in the late 1990's to $80 million per year after 2004-05. The difference creates a growing volume of deferred maintenance, which is practically nil in 1980-81, grows to $630 million in 1998-99 and to $1.3 billion in 2010-2011. The new capital spending required to accommodate the increase in student demand of 88,900 is estimated to be over $2 billion.3 The study summarizes its findings as follows: "This is a once in a generation challenge that has the potential to affect thousands of individual student lives as they seek to study, develop and perform research at one of Ontario's 17 universities."4
The demographic aspects of the PriceWaterhouseCoopers study can be seen in a slightly broader perspective in Figures 1 to 3. These figures address an issue often raised concerning new construction at Ontario universities: by building for the enrolment increase of the next decade, do we risk over-building when the echo of the baby boom starts into its downward phase? Figure 1 shows the Ontario population aged 18 to 24, which increases from 550,000 in 1961 to 1,240,000 in 1984; falls to 1,040,000 in 1997; rises to 1,290,000 in 2016; and falls to 1,140,000 in 2026.5 The first increase represents the baby boom; the second, the echo of the baby boom.
In Figure 2 we show a fairly steady increase in enrolments in Ontario universities for the 65 years from 1961 to 2026.6 The sharp upward shift after 2002 represents the Double Cohort which arises from secondary school reform in Ontario. Figure 3 shows the university participation rate in Ontario, defined as the ratio of Figure 2 to Figure 1, which is total enrolment from all sources divided by the population age 18-24 in Ontario.7 The sharp upward shift after 2002 is again caused by the Double Cohort, as is the temporary decline after 2004. We assume the participation rate increases by 0.1% a year (or 1% a decade) after 2010, which is an annual increase less than the average of previous decades.
Some demographers and government officials feared a significant reduction in university enrolments during the 1980s and 1990s because of the drop in the population age 18 to 24 during that period, evident for Ontario in Figure 1.8 In fact enrolments ignored the demographic drop, and expanded fairly steadily through the 1980s and early 1990s (Figure 2) as participation rates rose during that period (Figure 3). Comparing the echo of the baby boom to the baby boom itself, the drop after the peak of the echo will clearly be much less than the drop of the earlier period. Even the slight increase in participation rates assumed in our graphs (0.1% per year) is enough to keep enrolment constant after the demographic peak in 2016. Ontario's universities need not fear a rapid fall in demand after 2010 for demographic reasons; we may thus properly expand our facilities to meet the increased demand of the next decade.

In this changing environment, Western will need to consider a great many academic and financial issues, including two which are the subject of this short paper: how much new construction will we need to accommodate the additional students, and where should the new buildings be sited? We consider these questions within a twenty-year time horizon. As we begin the new construction to be funded by the SuperBuild program, we should have a clear plan for our physical space in the longer run of two decades. Careful planning is required if Western is to meet successfully its own "once in a generation challenge."
The Vision of the Master Plan for Campus Expansion to 2018:
Massive New Construction and a Proposed Redefinition of the Campus Core
The Campus Master Plan for Western approved by the Senate and Board in January, 1995, involved wide consultations and effort by a great many people; Western is the better for their commitment and hard work. The Master Plan has many important features, including:
Seen from the perspective of the year 2000, a striking aspect of the Master Plan is the extraordinary amount of new construction which it envisages for the 25-year period from 1993 to 2018.9 The volume of new construction plays a key role in the proposed redefinition of the campus core suggested by the Master Plan. As Western considers new construction over the next two decades, including the projects submitted to SuperBuild and the opportunities afforded by the relocation of the stadium, a review of these two aspects of the Master Plan is appropriate.
Using what appear to be linear extrapolations of actual floor area on campus from the 1960's to 1993, the Master Plan concludes that the University can expect to require additional building space from 1993 to 2018 of between 130,000 and 410,000 gross square meters (GSM).10 The emphasis throughout the Master Plan is on the maximum estimate, which is illustrated in Appendix II of the Master Plan with the construction of 65 new buildings with 427,000 GSM.11
This is a massive amount of new construction, which in just 25 years would increase space on campus by almost 80% as compared to the Master Plan's estimate of 540,000 GSM in 1993. To accommodate these buildings most of the construction in the Master Plan must be done on land on the west side of Western Road, much of which is not under the ownership or control of the University. Those who wrote the plan were aware of this and divided the listing of the 65 projects in the Appendix into two parts, involving lands east and west of Western Road, with the latter referred to as "the expansion lands." Table 1 shows the 65 projects divided into non-residential construction and residences.12 As line 7 of the table indicates, about two-thirds of the new space is west of Western Road. Of the space west of Western Road, over one-half is on land not owned by the University.13
This suggested concentration of buildings across Western Road led the Master Plan to propose a change in the definition of the campus core. What I will call the traditional definition of the campus core situated it on the east side of Western Road with University College at its centre. For example, in the 1947 Master Plan, the core was associated with a circle of a quarter-mile radius centered on University College. In the 1995 Master Plan, however, the authors propose that the center of the core be shifted west to Renaissance Square; the new core would extend up the Brescia driveway about halfway from Western Road to the main College building.14 The Master Plan locates twelve buildings on either side of Brescia Drive on land owned by the Ursuline Order and the Diocese of London. The twelve buildings have floor space of 111,000 GSM.15 Added to them are three buildings on the Springett parking lot with a total floor area of 51,000 GSM.16 The drive up to Brescia College from Western Road would be surrounded by very large buildings.17
Table 1
Estimates of New Construction from 1993 to 2018 in the Campus Master Plan
|
|
|
Non-Residential |
Residences |
Total |
|
|
A. All Buildings |
|||
|
1 |
Buildings |
37 |
28 |
65 |
|
2 |
Gross Square Meters |
285,000 |
140,000 |
427,000 |
|
|
|
|||
|
|
B. East of Western Road |
|||
|
3 |
Buildings |
13 |
9 |
22 |
|
4 |
Gross Square Meters |
92,000 |
48,000 |
142,000 |
|
|
|
|||
|
|
C. West of Western Road |
|||
|
5 |
Buildings |
24 |
19 |
43 |
|
6 |
Gross Square Meters |
193,000 |
92,000 |
285,000 |
|
7 |
Percent of total GSM |
68% |
66% |
67% |
|
|
|
|
|
|
|
|
D. West of Western Road, Land not Owned by the University |
|||
|
8 |
Buildings |
12 |
10 |
22 |
|
9 |
Gross Square Meters |
101,000 |
48,000 |
149,000 |
The figures are rounded to the nearest 1,000 square meters and exclude
buildings at the Research Park. Line 7 is line 6 as a percentage of line 2.
This redefinition of Western's campus core has two problems. First, it puts a significant part of the campus core on land that Western does not own. When the draft Master Plan was distributed in 1993 it had been two years since the recommendation in the Campus Planning Guidelines that the University acquire rights of first refusal on these properties.18 The Master Plan makes no mention of the results of that effort, nor of any reaction of the Ursuline Order, Brescia College, or the Diocese of London to the proposed massive construction of Western buildings on land they own. Indeed, when the Master Plan was distributed there had been no granting of rights of first refusal, and there is none to this day. And of course even the existence of such rights would not imply that the properties would be for sale when Western needed them.
A second problem with the redefined core of the 1995 Master Plan is that there is a major roadway running through it, Western Road. In line with the ten-year program of the City of London Transportation Review, the Master Plan proposes that Western Road be widened to four lanes from Platts Lane to Windermere Road. With two bike lanes and a median, the road would be 21 meters wide, and 26 meters from sidewalk to sidewalk.19 Even this major roadway may be only a ten year solution, since the Transportation Review suggests a further widening will be required in a decade or two to six lanes. The Master Plan appears to avoid this problem with a vague reference to "traffic demand management policies."20 While the University will do all that it can to make Western Road as quiet and safe for pedestrians as possible in the future, we can not know now how successful our efforts will be. One is left imagining the impact on the current campus core if Oxford Drive were to become a four lane road, with six lanes possible in ten or twenty years.
An Alternative Vision of Campus Expansion to 2020:
Moderate New Construction and Maintenance of the Traditional Campus Core
New Construction
As noted above, the Master Plan's estimates of future space needs are based on the linear extrapolation of the growth of past space. In particular, the Master Plan makes no estimates whatever of future enrolment or employment at Western.21 My view is that the maximum estimates of space growth to 2018 which underpin the Master Plan are on the high side, probably by a wide margin. In any case, a serious estimate of future space needs should be related to assumptions about enrolment and employment at Western and to the growing problem of deferred maintenance on campus. In what follows, we focus primarily on non-residential construction. Our alternative vision for campus expansion accepts the major principles of the Master Plan, while reaching different conclusions on the size of expansion and the definition of the campus core.
Table 2 sets out simulations of future enrolment, employment, and space to 2020 for the constituent University, excluding the Affiliated Colleges. The figures make several assumptions: a significant growth in the undergraduate population beyond that foreseen in our SuperBuild proposal; a proportional growth of graduate students greater than that of undergraduates; some reduction in the student/faculty and student/staff ratios; and economies of space relative to the strict application of the MET/COU space formula. The 100,000 GSM of new construction is about 35% of the 285,000 GSM of additional non-residential space in the maximum estimate of the Master Plan for 2018. Space per FTE, in line 5 of the table, is roughly constant before and after 2000.22
Deferred Maintenance and Capital Budgets
If this estimate of new space seems too modest, it must be remembered that during this same period to 2020, the University will have a massive requirement for deferred maintenance work. Table 3 shows forty major non-residential buildings at Western by the date they were opened. Buildings constructed before 1980 will be at least 40 years old in 2020; we assume most of these buildings will require significant maintenance work by the latter date. As Table 3 shows, there are over 300,000 GSM of space in buildings which opened before 1980.23 While only a part of this will be subject to major renovation, there seems to be no question that annual expenditures on major building maintenance will rise from their levels of recent years.
To discuss the cost of new construction and deferred maintenance involves an understanding of how Western plans and accounts for capital expenditures. We may take the following figures from 1998-1999 as an example:
Table 2
Simulations of Enrolment, Employment, and Space to 2020
|
|
|
2000 (1) |
Change 2000 to 2020 (2) |
|
1 |
Undergraduate FTEs |
19,600 |
5,000 |
|
2 |
Graduate FTEs |
3,000 |
1,000 |
|
3 |
Total FTEs |
22,600 |
6,000 |
|
4 |
Non-Residential Space (GSM) |
385,000 |
100,000 |
|
5 |
Space per FTE (GSM) |
17.0 |
16.7 |
|
|
|
|
|
|
6 |
Faculty |
960 |
350 |
|
7 |
Staff |
1,780 |
550 |
|
8 |
Student/Faculty Ratio |
23.5 |
17.1 |
|
9 |
Student/Staff Ratio |
12.7 |
10.9 |
|
Notes: |
In column (2), the ratios in lines 5, 8, and 9 are based on the figures in column (2); thus in line 5, 16.7 =100,000/6,000. |
|
Line 4, column (2), is new construction during the period. |
|
|
Years are financial years ending on April 30. |
|
|
Faculty in line 6 excludes clinicians. |
|
|
Notes by line: 3 = 2 + 1, 5 = 4/3; 8 = 3/6; 9 = 3/7. |
Table 3
Major Non-Residential Buildings at Western, by Date Opened
|
|
|
Date Opened |
Gross sq m |
Decade Total |
|
Additions and Major Renovations |
||
|
1 |
Physics & Astronomy |
1924 |
9,004 |
|
|
|
|
|
|
2 |
University College |
1924 |
11,169 |
20,173 |
|
1963 |
1967 |
1998 |
|
|
|
|
|
|
|
|
|
|
|
3 |
Cronyn Observatory |
1940 |
338 |
|
|
|
|
|
|
4 |
McIntosh Gallery |
1942 |
481 |
|
|
1999 |
|
|
|
5 |
Stevenson Lawson Building |
1948 |
11,465 |
|
|
1956 |
1962 |
1971 |
|
6 |
Collip Building |
1949 |
1,172 |
13,456 |
|
|
|
|
|
|
|
|
|
|
|
|
|
|
|
7 |
Thames Hall |
1950 |
8,608 |
|
|
|
|
|
|
8 |
Biological & Geological Sciences |
1956 |
14,722 |
|
|
1966 |
|
|
|
9 |
Biological & Geological Greenhouses |
1957 |
1,106 |
|
|
1962 |
1964 |
1968 |
|
10 |
Somerville House |
1957 |
10,104 |
|
|
1967 |
1999 |
|
|
11 |
Ivey School of Business Building |
1957 |
10,489 |
|
|
1962 |
1969 |
|
|
12 |
Engineering Sciences Building |
1958 |
18,183 |
63,212 |
|
1971 |
|
|
|
|
|
|
|
|
|
|
|
|
|
13 |
Kresge Building |
1960 |
2,206 |
|
|
|
|
|
|
14 |
Middlesex College |
1960 |
11,264 |
|
|
1966 |
1998 |
|
|
15 |
Law Building |
1961 |
8,228 |
|
|
1969 |
1993 |
|
|
16 |
Molecular Biology Laboratory |
1961 |
1,876 |
|
|
|
|
|
|
17 |
Services Building |
1963 |
5,350 |
|
|
1972 |
1985 |
|
|
18 |
Althouse Faculty of Education Building |
1965 |
13,789 |
|
|
|
|
|
|
19 |
Bio-Engineering Building |
1965 |
1,357 |
|
|
|
|
|
|
20 |
Chemistry Building |
1965 |
11,242 |
|
|
1976 |
1997 |
|
|
21 |
Elborn College |
1965 |
13,541 |
|
|
1991 |
1999 |
|
|
22 |
Medical Sciences Building |
1965 |
20,380 |
|
|
1993 |
|
|
|
23 |
Natural Sciences Centre |
1965 |
18,030 |
|
|
1972 |
1991 |
|
|
24 |
Talbot College |
1966 |
12,059 |
|
|
|
|
|
|
25 |
Graphic Services Building |
1967 |
2,031 |
|
|
|
|
|
|
26 |
Dental Sciences Building |
1968 |
18,921 |
|
|
|
|
|
|
27 |
Staging Building |
1968 |
3,772 |
144,046 |
|
|
|
|
|
|
|
|
|
|
|
|
|
|
|
28 |
Central Food Commissary |
1970 |
4,046 |
|
|
|
|
|
|
29 |
Music Building |
1970 |
4,961 |
|
|
|
|
|
|
30 |
Weldon Library |
1970 |
22,702 |
|
|
1998 |
|
|
|
31 |
Social Science Centre |
1971 |
33,757 |
|
|
1997 |
|
|
|
32 |
University Community Centre |
1971 |
29,135 |
|
|
1992 |
1993 |
1996 |
|
33 |
Thompson Recreation & Athletic Cen. |
1973 |
9,755 |
|
|
|
|
|
|
34 |
Health Sciences Addition |
1974 |
6,927 |
111,283 |
|
|
|
|
|
|
|
|
|
|
|
|
|
|
|
35 |
Boundary Layer Wind Tunnel |
1983 |
3,094 |
|
|
|
|
|
|
36 |
National Centre for Management R&D |
1986 |
3,475 |
|
|
|
|
|
|
37 |
Alumni Hall |
1988 |
7,042 |
13,611 |
|
|
|
|
|
|
|
|
|
|
|
|
|
|
|
38 |
Laurene O Paterson Building (WSC) |
1991 |
7,636 |
|
|
|
|
|
|
39 |
Visual Arts Centre |
1993 |
6,782 |
|
|
|
|
|
|
40 |
3M Centre |
1996 |
5,297 |
19,715 |
|
|
|
|
|
|
|
|
|
|
|
|
|
|
|
41 |
Total |
|
385,496 |
|
|
|
|
|
|
a. |
Central Capital Expenditures in the Capital Budget |
12.2 |
|
b. |
Unit-Funded Capital Expenditures in the Capital Budget |
16.6 |
|
c. |
Other Increases to Capital Assets |
11.9 |
|
d. |
Total Increase to Capital Assets in the Financial Statements |
$40.7 million |
Lines a and b are from the 1999-2000 Capital Budget, Tables 15 and 20. Line d is from the Financial Statements, and line c is a residual.24 Line b includes projects from the Ancillaries and Residences and major projects funded by certain other units. Line c includes projects and equipment funded from research grants, and equipment funded from operating funds in operating units. Only the central expenditures in line a are included in Table 4 below; these central expenditures amounted to about 30% of total capital expenditures in 1998-1999 and were directed for the most part at buildings and infrastructure.
Table 4 shows past central expenditures in the Capital Budget, comparable to line a above, and excluding unit-funded expenditures in ancillaries and residences. The table also offers illustrative simulations of future central capital expenditures. Columns (1) to (3) indicate the average annual expenditures over the periods 1996 to 2000, 2001 to 2005, and 2006 to 2020. Column (4) shows the total expenditures over the twenty-year period from 2001 to 2020.
We focus first on column (1), which shows average annual capital spending for the last five years, as presented in Western's annual Capital Budget. Construction of new space averaged about $3 million per year, with spending on three projects: the 3M Centre, a large classroom, and the new stadium.25 Average annual deferred maintenance expenditures were $4.3 million (line 6), about half of which (in line 4) was devoted to four major building renovations: Chemistry fumehoods, Social Science animal quarters, Middlesex College, and the start of the Dentistry facilities renewal. The balance of deferred maintenance spending (line 5) was on smaller projects spread throughout the University, much of it for support facilities and infrastructure largely invisible to users.
Major renovations not included in deferred maintenance (line 7) average $2 million a year from 1996 to 2000, with spending on three major projects: Conron Hall, Weldon Library, and the Academic Space Realignment involving renovated teaching space in Somerville House, Elborn College, and Talbot College. Other expenditures (line 8) included everything else, from a new phone switch to numerous small projects. Average total capital expenditures (line 9) were $10.4 million per year. As lines 10 to 13 show, most of our capital expenditures were not directed to new space, but rather to the better use of space we already have.
Looking forward, we should expect a sharp rise in capital spending over the next two decades, simulated in columns (2) to (4) of Table 4. Line 1 shows new construction averaging 8,000 GSM per year from 2001 to 2005 during the SuperBuild period, falling to 4,000 GSM per year thereafter, for a total of 100,000 GSM during the twenty years, as shown in column (4). Line 2 is estimated with an average cost of $2,500 per GSM of construction of new space.
Table 4 also shows substantial future growth in deferred maintenance expenditures. Line 3 shows major renovations which average 3,000 GSM per year over the next five years, and increase to 4,000 GSM per year thereafter.26 At a cost of $2,000 per square meter, the annual expenditures in line 4 increase from $6 million in 2001 to $8 million in 2006.27 We also assume annual expenditures on smaller deferred maintenance projects (line 4) of $4 million after 2000. Total annual deferred maintenance spending (line 5) rises to $12 million after 2005, over 2.5 times its level during the period from 1996 to 2000. Part of the financing for this expenditure will come from the operating budget. Following a recommendation of our Strategic Plan,28 the University is increasing its transfer from the operating budget to the capital budget for deferred maintenance by $750,000 a year; that transfer was $3.5 million in 1999-2000 and will reach $8.0 million in 2005-2006.
Table 4
Renovations, New Construction, and Capital Expenditures, 1996 to 2020
|
|
|
Average Annual Sq M and Expenditures |
|
Total |
||
|
|
|
1996 to 2000 (1) |
2001 to 2005 (2) |
2006 to 2020 (3) |
|
2001 to 2020 (4) |
|
|
A. Construction of New Space |
|
|
|
|
|
|
1 |
Square Meters |
|
8,000 |
4,000 |
|
100,000 |
|
2 |
Cost of New Space ($m) |
3.0 |
20.0 |
10.0 |
|
250.0 |
|
|
|
|
|
|
|
|
|
|
B. Deferred Maintenance |
|
|
|
|
|
|
3 |
Major Renovations, Square Meters |
|
3,000 |
4,000 |
|
75,000 |
|
4 |
Major Renovations, cost ($m) |
2.1 |
6.0 |
8.0 |
|
150.0 |
|
5 |
Other Deferred Maintenance ($m) |
2.3 |
4.0 |
4.0 |
|
80.0 |
|
6 |
Total Deferred Maintenance ($m) |
4.3 |
10.0 |
12.0 |
|
230.0 |
|
|
|
|
|
|
|
|
|
|
C. Other Capital Expenditures |
|
|
|
|
|
|
7 |
Major Renovations, not in DM ($m) |
2.0 |
2.5 |
3.0 |
|
57.5 |
|
8 |
Other Expenditures ($m) |
1.1 |
1.5 |
2.0 |
|
37.5 |
|
|
|
|
|
|
|
|
|
9 |
Total Capital Expenditures ($m) |
10.4 |
34.0 |
27.0 |
|
575.0 |
|
|
|
|
|
|
|
|
|
|
Percentage Distribution: |
|
|
|
|
|
|
10 |
New Space |
29% |
59% |
37% |
|
43% |
|
11 |
Deferred Maintenance |
41% |
29% |
44% |
|
40% |
|
12 |
Major Renovations, not in DM |
19% |
7% |
11% |
|
10% |
|
13 |
Other |
11% |
4% |
7% |
|
7% |
|
Notes: |
Figures exclude expenditures for residential and ancillary purposes. |
|
|
Column (4) is total dollars or square meters from 2001 to 2020, calculated as 5 times column (2) plus 15 times column (3). |
|
|
Source: see text |
Lines 7 and 8 show modest increases in annual spending after 2000 on major renovations which are not in deferred maintenance and on all other capital expenditures. Average annual capital expenditures in all categories are $10.4 million in 1996-2000, $34 million in 2001-2005, and $27 million in 2006-2020. Over the two decades after 2000 only about 43% of our capital spending would be for new space; the balance would improve the use of existing space. By these simulations, the next two decades would see new construction of some 100,000 GSM and major building overhauls of a similar magnitude.29 As we build a larger campus we must rebuild the existing campus; over the next two decades the rebuilding in terms of major building overhauls could be as great in volume as the new construction. Thus if our new construction figures seem modest, it is in part because of the heavy cost of the renovation needed on our older buildings.
The next twenty years will involve enormous challenges for Western in financing needed capital expenditures. For example, our approved SuperBuild project will be financed from several sources: the Provincial SuperBuild funds; other Provincial funds; CFI funds from the federal government; funds from the City of London; private funding; and funds from Western's annual budgets and reserves. Looking forward, even the sum of all available funding sources may not be sufficient to meet the needs set out in Table 4, so that the simulations there of new construction and renovations may be on the high side. Such potential financing constraints reinforce our view that the still higher figures for new construction in the Master Plan are significant over-estimates.
The Campus Core and the South Valley Site
The use of the 100,000 square meter figure for University expansion to 2020 allows us to maintain the traditional definition of the campus core as on the east side of Western road. The campus core in this alternative vision of our future would remain those University-owned lands in the area bounded by Western Road, Medway Creek, the Thames River, and Huron Drive. In this area, the Master Plan identifies sites for 128,000 additional GSM of space, well over our 100,000 figure for the next 20 years.30 The core so defined includes the South Valley Site, which is discussed in Western's Strategic Plan and will be opened up in 2001 by the relocation of the stadium.31 In the Master Plan the stadium remains on its current site, and new construction in the South Valley Site is limited to 26,000 GSM. With the removal of the stadium, additional construction in this area will be possible.
The price of maintaining this more compact core is an absolute priority for siting new teaching and research buildings within it. One result will be relatively easy walking distances among classrooms, libraries, teaching labs, and research labs for undergraduates, graduate students, faculty, and staff. Another result will be that residences are put outside the core but in reasonable walking distance to it: Essex Hall and Elgin Hall can serve as examples.
The difference between the Master Plan vision of the campus core and the alternative set out here can be seen in the treatment of the stadium. The Master Plan considers two options for the stadium: replacement of the east side stands and a completely new stadium.32 Even in the latter case, there is no discussion of moving the location of the stadium to a less central area. The "core" lands on the west side of Western Road appear so abundant that the issue is not raised.
If, however, we wish to maintain the traditional definition of the campus core, the stadium precinct is critical to keeping future teaching and research space in the core and every effort should be made to move the stadium out of that precinct. This issue was raised in the University's Strategic Plan of 1995, which considered moving the stadium off the core campus, possibly to the Althouse precinct. Happily, in 1998 the University was granted permission to construct a new stadium on the flood plain south of the current stadium, land on which an academic building would not be allowed for environmental reasons.33 In the alternative vision of the core, there is no more important issue in physical planning than making the best use of the South Valley Site in support of teaching and research.
The relocation of the stadium thus opens up prime land in the heart of the campus. If we remove the Graphics Building as well as the old stadium, the South Valley Site has an area of 9.8 acres. In considering architecture for the South Valley Site, we like the approach of Leadership in Learning, which calls on the University to consider "the creation of a series of academic building in a consistent architectural style, such as we have on the east side of Oxford Drive." It should be possible to locate four large buildings on the site, with four floors in each and total floor space of some 65,000 GSM. Prime candidates for the site would be one of the two major classroom buildings in our SuperBuild submission and a new Business building. The latter might be constructed sometime after 2004, allowing Education to move into the old Business building so that the Althouse Building could be demolished. Physical Plant is currently considering two options for Huron Drive: leaving it where it is, and moving it closer to the river, as suggested in the Master Plan. The South Valley Site is a complex area, bordering on the flood plain and the river, with Huron Drive running through the area: its use will require very careful planning, which should look ahead at least two decades.
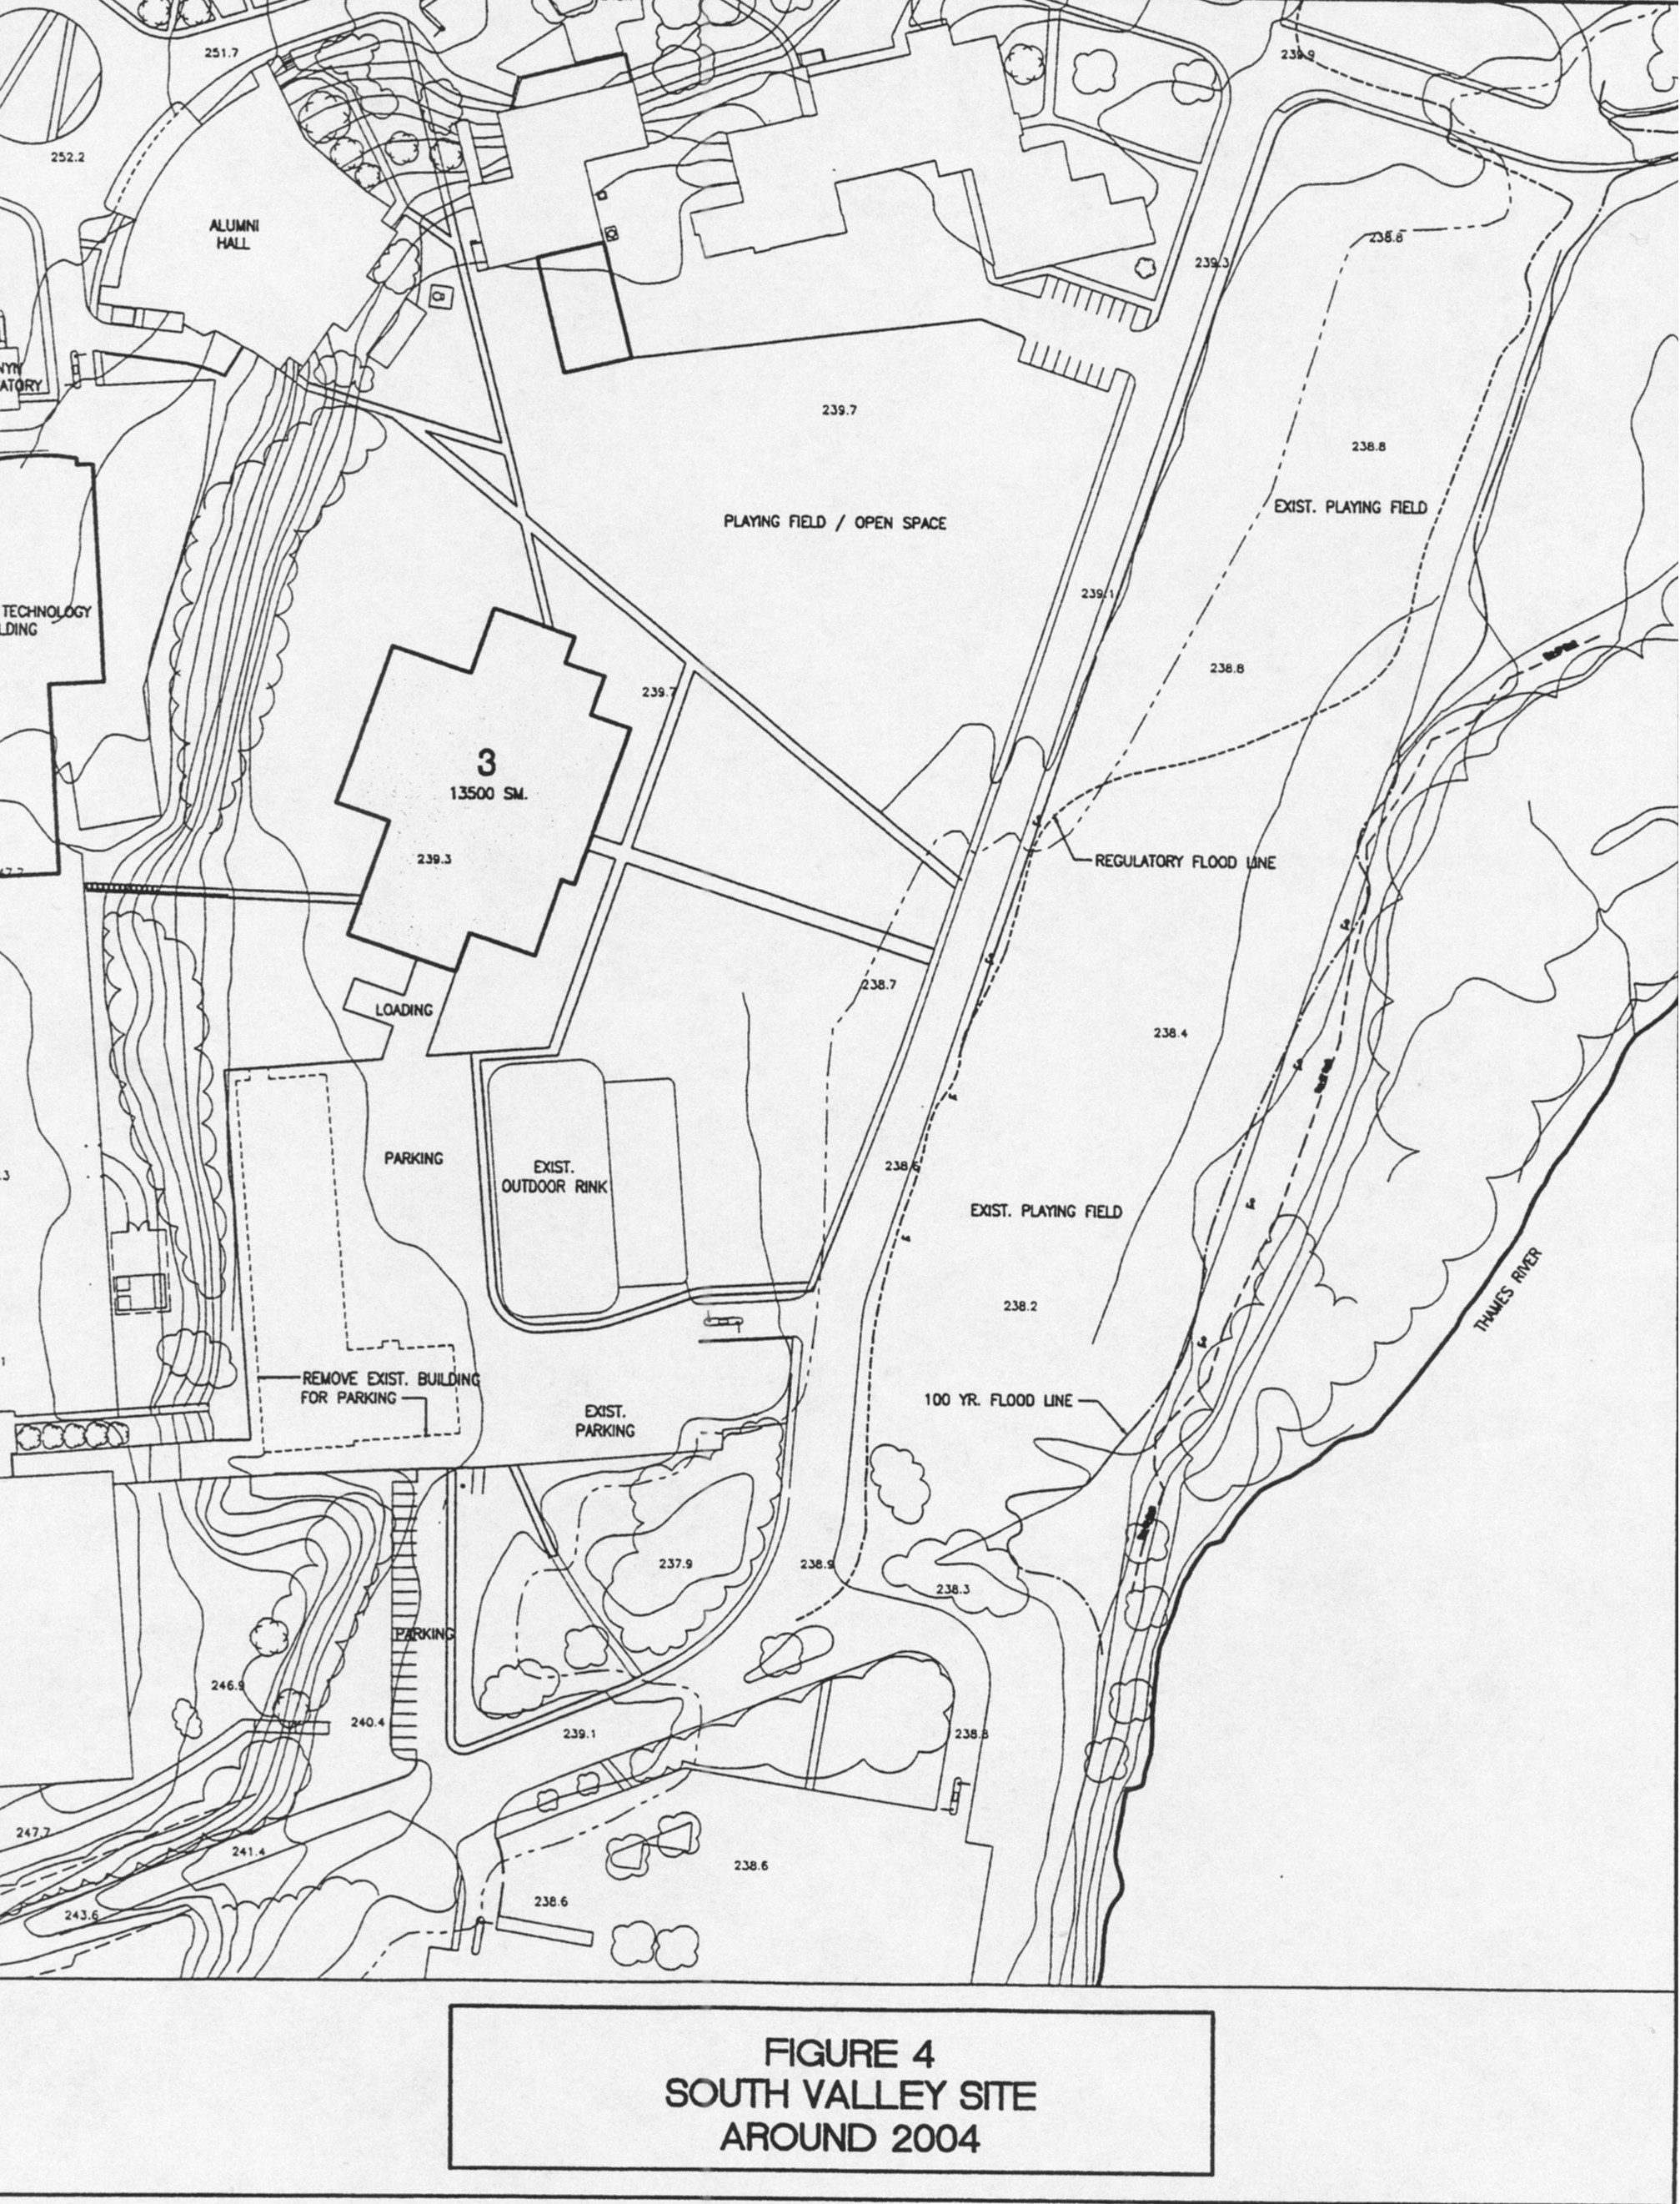
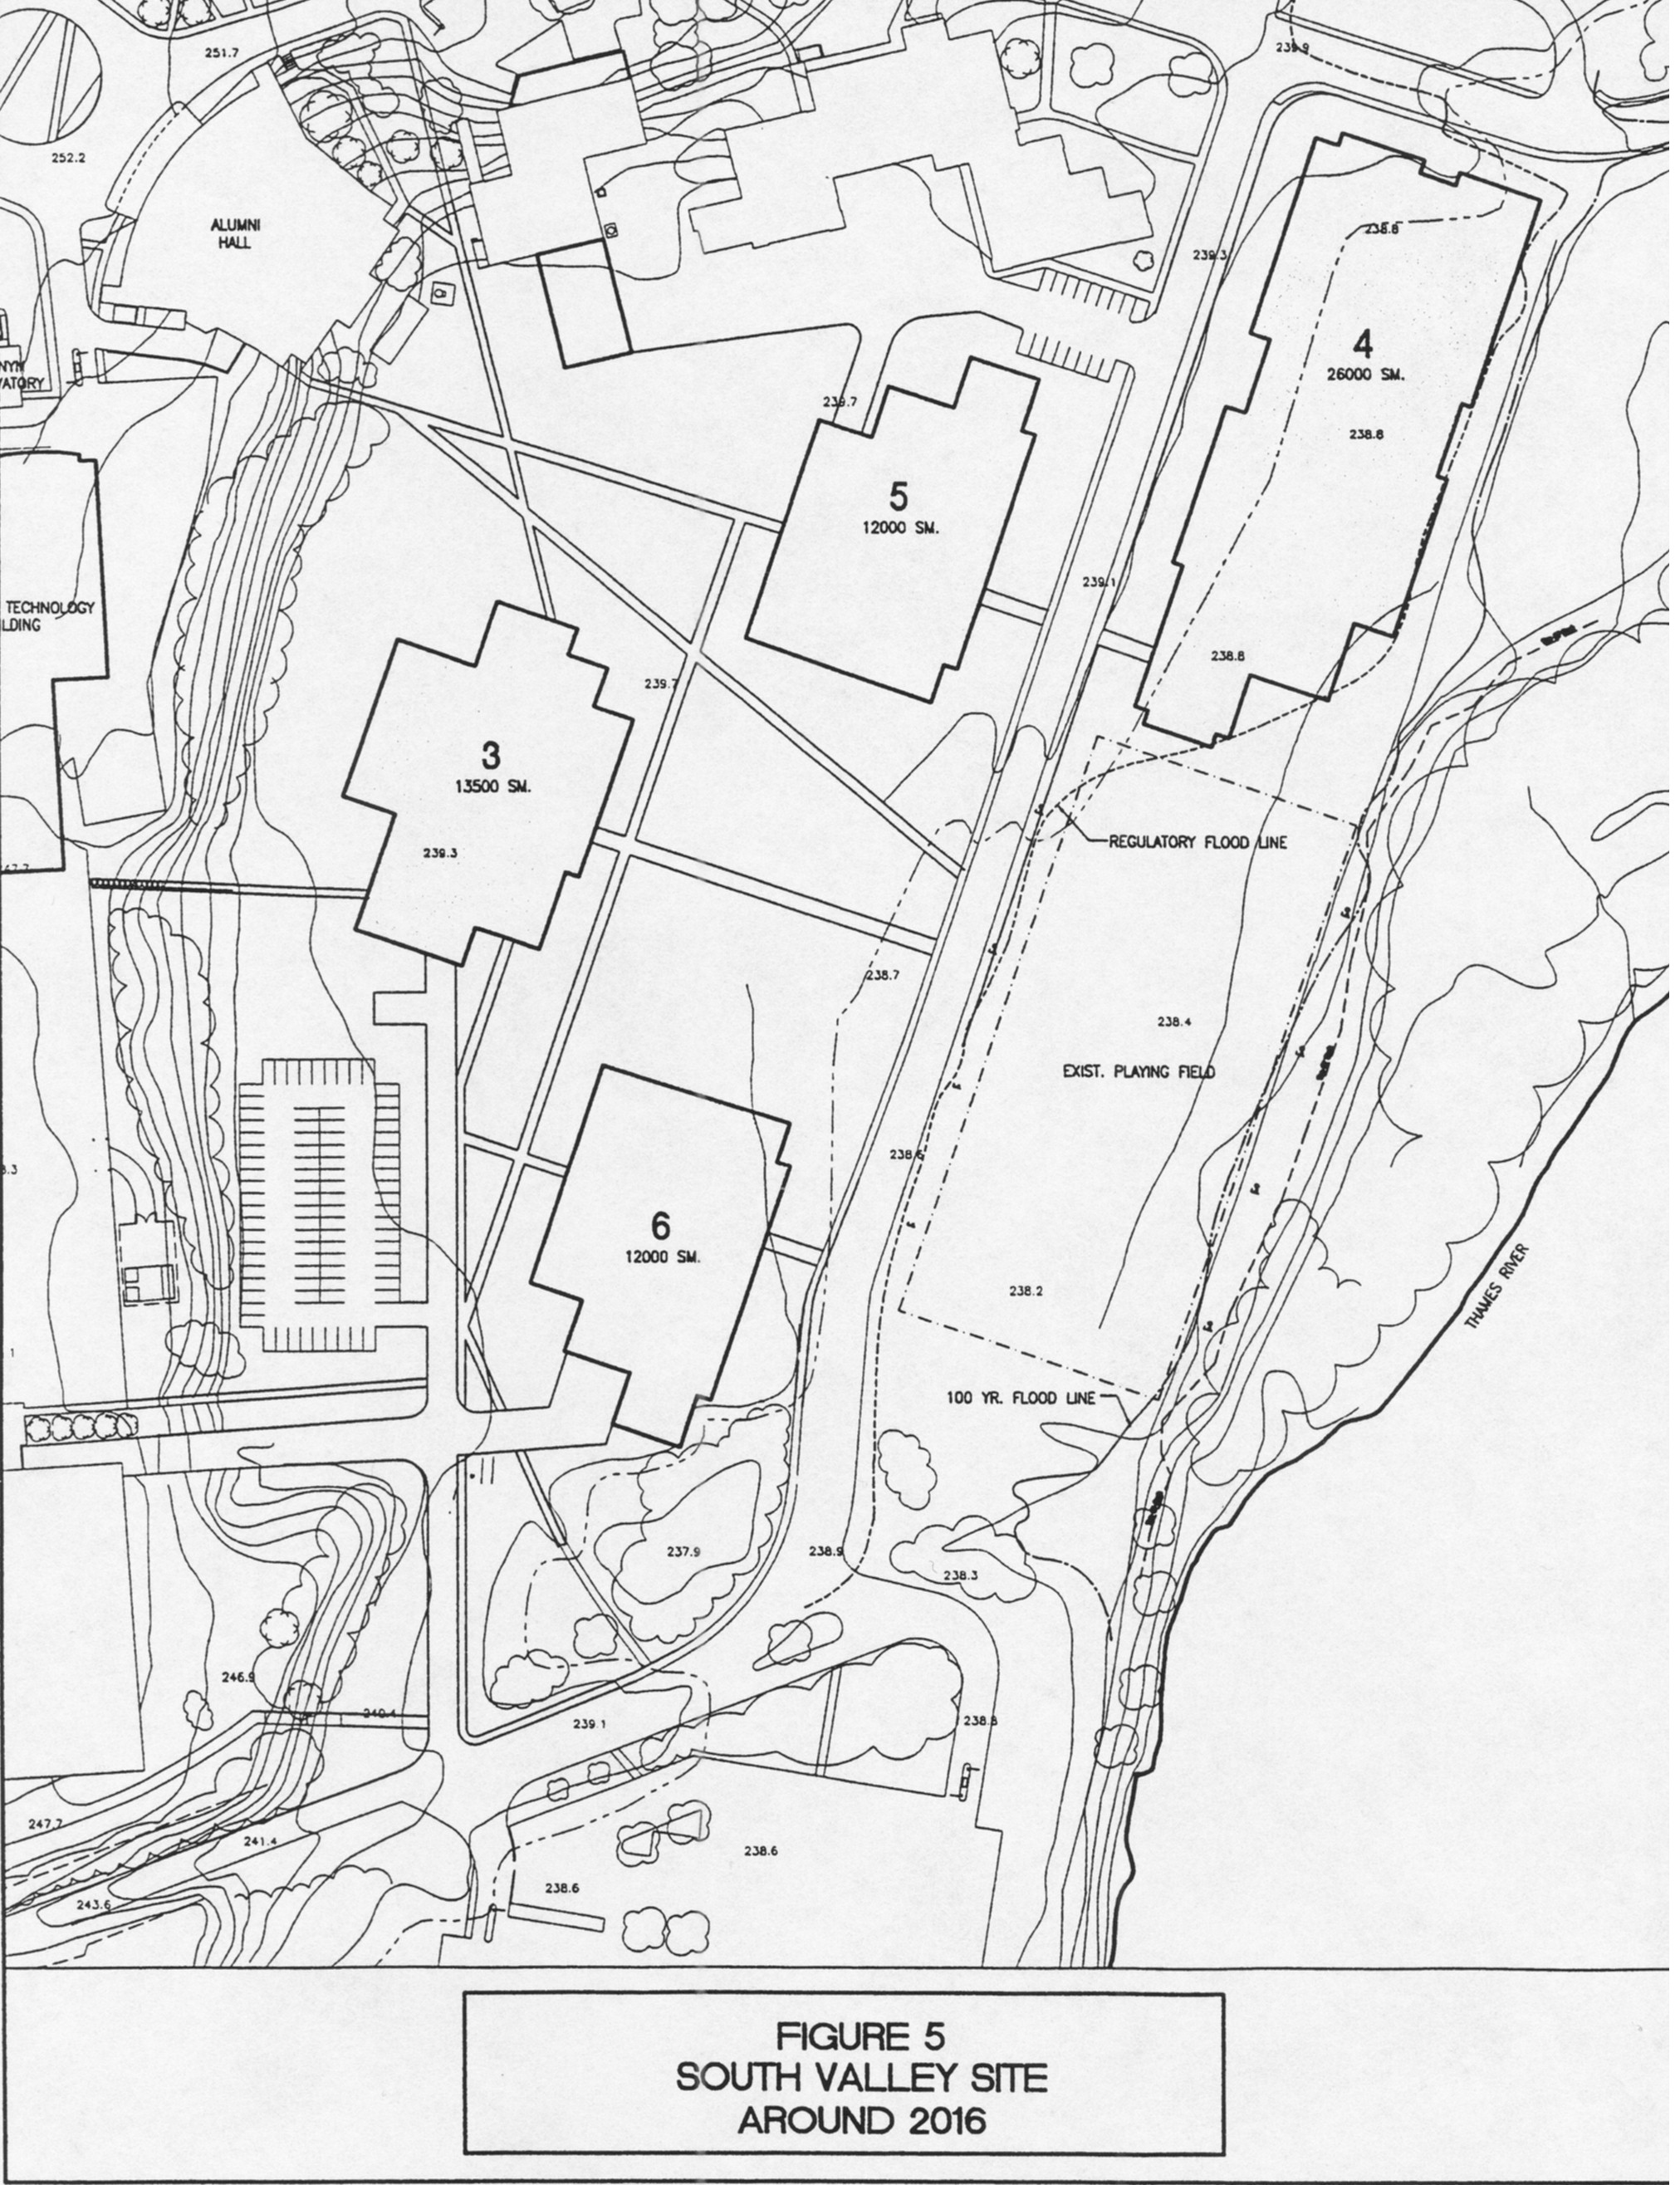
Table 5 shows one possibility for siting eight large academic buildings in the core campus.34 Our SuperBuild submission would involve the construction of three large buildings on the sites shown.35 The Bioengineering Building would be torn down and the Advanced Technology Centre put in its place. One of our two large classroom buildings would be put on the south side of Visual Arts, and the other, on the South Valley Site.36 For the period after SuperBuild, five sites would be available for large academic buildings, as shown in the table. A possible date for opening the Business Building would be 2008, involving a three-year fund-raising campaign (2005-2008) after the conclusion of Campaign Western in 2004. Beginning in 2008, Table 5 illustrates a possible scenario in which one major building is opened every four years. Buildings 1 to 7 would be opened during the next two decades with total GSM of 103,500, slightly exceeding the requirement of 100,000 GSM set out in line 4 of Table 2.
The fourth building in the South Valley Site (line 6) might be required about the middle of the second decade of the century. We would then still have two sites which could accommodate large buildings, the Weldon parking lot and the north side of Visual Arts. Finally the Campus Master Plan identifies six other buildings on three sites which would provide additional space for academic buildings in the campus core.37 The table shows a potential for new academic space in the campus core of some 172,300 GSM, which appears to be well beyond our requirements for the next two decades. Figures 4 and 5 show possible building locations in the South Valley Site in 2004 and 2016, with the buildings numbered from 3 to 6 as in Table 4. In 2004, Figure 4 shows the South Valley Site with the stadium and Graphics Building removed, and one of the two SuperBuild classroom buildings in the northwest part of the site. The two existing playing fields on the east side of Huron Drive are untouched. The removal of the Graphics Building allows for some additional parking in the southwest area of the site. There is considerable green space west of Huron Drive. By 2016 the site might look as in Figure 5, with four buildings including one on the east side of Huron Drive. One of the two original playing fields remains on the east side of Huron Drive.
Table 5
Possible Sites for Academic Buildings in the Campus Core
|
|
Building |
GSM |
Possible Site |
Potential Opening |
|
|
A. Large Academic Buildings, SuperBuild Accessibility and Quality Project |
|||
|
1 |
Advanced Technology Centre |
10,000 |
Bioengineering Site |
2002/3 |
|
2 |
Large Classroom |
10,000 |
South of Visual Arts |
2003/4 |
|
3 |
Large Classroom |
13,500 |
South Valley Site |
2003/4 |
|
|
Sub-Total |
33,500 |
|
|
|
|
|
|
|
|
|
|
B. Other Large Academic Buildings |
|||
|
4 |
Business |
26,000 |
South Valley Site |
2008? |
|
5 |
Academic |
12,000 |
South Valley Site |
2012? |
|
6 |
Academic |
12,000 |
South Valley Site |
2016? |
|
7 |
Academic |
20,000 |
North of Visual Arts |
2020? |
|
8 |
Academic |
18,500 |
Weldon Parking Lot |
2024? |
|
|
Sub-Total |
88,500 |
|
|
|
|
|
|
|
|
|
|
C. Other Sites Identified in the Campus Master Plan |
|||
|
9 |
Six Buildings |
50,300 |
Three Master Plan precincts |
|
|
|
|
|
|
|
|
|
Grand Total |
172,300 |
|
|
|
Notes: |
Line 8: GSM are from "Western in the New Millennium." |
|
|
Line 9: Campus Master Plan, Appendix II, Buildings 4, 5, 11, 12, 13, and 20. |
Residences
While our focus in this paper is on non-residential buildings, some reference to residences is in order. Table 6 shows the growth of Western's residences, beginning in 1959 with Medway Hall. If we add to our eleven residences the apartments and townhouses of Platt's Lane, the total stock of residential space is some 189,000 GSM with accommodation for nearly 5,000 residents. Our residences have consistently set aside money for maintenance and have no deferred maintenance problem. The three Affiliated Colleges have about 860 residence beds. Beginning in 2000, the University will manage the Westminster residence, which is owned by the United Church of Canada and has some 250 beds.
Table 6
Major Residential Buildings at Western, by Date Opened
|
|
Building |
Date Opened |
Gross sq m |
Decade Total |
|
Residents |
|
1 |
Medway Hall Residence |
1959 |
9,797 |
9,797 |
|
303 |
|
|
|
|
|
|
|
|
|
2 |
Sydenham Hall Residence |
1963 |
10,241 |
|
|
311 |
|
3 |
Delaware Hall Residence |
1966 |
16,427 |
|
|
451 |
|
4 |
Ausable Hall Apartments |
1968 |
4,404 |
|
|
198 |
|
5 |
Bayfield Hall Apartments |
1968 |
23,128 |
|
|
300 |
|
6 |
Beaver Hall Apartments |
1968 |
5,524 |
|
|
198 |
|
7 |
Saugeen-Maitland Hall Residence |
1968 |
28,759 |
88,483 |
|
1,252 |
|
|
|
|
|
|
|
|
|
8 |
Alumni House Residence |
1985 |
6,619 |
6,619 |
|
240 |
|
|
|
|
|
|
|
|
|
9 |
Lambton Hall Apartments |
1990 |
14,419 |
|
|
300 |
|
10 |
Essex Hall |
1997 |
18,587 |
|
|
508 |
|
11 |
Elgin Hall |
1999 |
18,291 |
51,297 |
|
407 |
|
|
|
|
|
|
|
|
|
12 |
Subtotal |
|
156,196 |
|
|
4,468 |
|
|
|
|
|
|
|
|
|
13 |
Platt's Lane Estates |
1969/70 |
33,139 |
|
|
400 |
|
|
|
|
|
|
|
|
|
14 |
Total |
|
189,335 |
|
|
4,868 |
|
Note: |
The last column for Platt's Lane Estates indicates 400 units for married students, including 204 apartments and 196 townhouses; thus each family is treated as a "resident." |
The University would appear to require another residence the size of Essex Hall or Elgin Hall to accommodate the growing first year class of the double cohort and echo of the baby boom. Ideally that residence would open in September of 2003. In 2004 or thereafter the University may consider construction of another apartment style residence building, which initially could help with the Double Cohort demands, but would eventually give preference to graduate students, married students, and students with children. Such an apartment building would be particularly attractive if it included easy access to daycare facilities. While caution is important in building residences which last for 40 years or more, there appears to be a large unmet demand for residence spaces among undergraduates after first year and among graduate students.38 With regard to the location of new residences, we repeat the suggestion made above that residences should be built over the next two decades on land outside the campus core but near to it.
Student Space and Student Services
Our planning for new construction should involve space in new buildings for students to gather and interact: readings areas, lounges, coffee houses, and the like. We will also need to find additional space for student services, such as the Student Development Centre and Campus Recreation. Many of these services are dealing with cramped space today and will require additional space as we plan for an expansion in enrolment. In designing the layout of the two large classroom buildings in our SuperBuild project, we will need to pay close attention to student space and student services. More generally, most of our services and support units will require more space as the University expands and we must integrate their space needs into our planning.
Infrastructure
The University's aging infrastructure will be inadequate to meet the growth in space described above. Physical Plant has identified some $8.5 million in infrastructure expenditures as required for the SuperBuild expansion alone. These include renovation of the South Substation for electrical distribution; investments to distribute power, chilled water, and steam to the new buildings; a co-generation project for more efficient power generation; and sanitary sewers to the new buildings.39
A typical example of the infrastructure problems of an aging yet growing campus is that of the old sewer line which runs down the river valley near the Visual Arts Building south past the new Stadium site, joining a city sewer off campus. That line is now full. Physical Plant is now estimating the cost of pumping part of the sewage from buildings along the line up to the major city sewer which runs down Western Road. This, too, is a cost of campus expansion.
Parking
Western currently has 5,959 parking spaces for permit holders (faculty, staff, and students) and for visitors. Construction associated with SuperBuild and a new residence could eliminate up to 700 of these spaces, depending on the sites chosen for construction. During working hours when classes are in session there is already a low vacancy rate in our parking lots. Limiting permit sales does not appear to offer a long-term solution to the potential parking shortage. As Western expands, parking congestion will increase significantly unless new spaces are introduced.
Table 7 sets out four options for additional parking which are developed in a recent Physical Plant document. The Garage option involves a multi-level parking structure on the Social Sciences parking lot, a site very convenient for visitors to the campus. Other sites could also be considered for a parking garage. The Stadium option is a temporary surface lot on the site of the current stadium, which would be removed at some point in favor of building construction. The Althouse site could be either on the practice field (which would have to be replaced) or in other areas on the Althouse precinct. The Fram site would be approached from the Western Road side and would involve a shuttle bus to the campus core.
The lines in Table 7 may be explained with the Garage option, which has 450 spaces, but removes 141 existing spaces, for a net change of 309 additional spaces. The capital cost is $6.3 million, or some $20,000 per space. The parking revenues from the Garage would be less than the annual costs (including the debt payments), resulting in an annual operating loss of $72,000, or $233 per space. Assuming 7,700 permit holders,40 it would require an increase of 78 cents in the cost of a monthly permit for all permit holders to finance the $72,000 loss. The three other options have lower capital costs but, paradoxically, higher annual operating losses. This is so because the Garage is assumed to generate extremely high revenues per space from visitor parking. We reach no conclusions here on the solution to the parking problem, but simply note it must be addressed as we plan our expansion.
Table 7
Four Options for Additional Parking
|
|
|
Garage |
Stadium |
Althouse |
Fram |
|
1 |
Total new spaces |
450 |
650 |
650 |
1,000 |
|
2 |
Additional spaces |
309 |
650 |
650 |
1,000 |
|
3 |
Capital cost ($ million) |
6.30 |
2.28 |
1.63 |
4.00 |
|
4 |
Capital cost per add. space ($) |
20,388 |
3,508 |
2,508 |
4,000 |
|
|
|
|
|
|
|
|
5 |
Annual operating loss ($) |
72,000 |
268,000 |
174,000 |
552,000 |
|
6 |
Loss per additional space |
233 |
412 |
268 |
552 |
|
7 |
Monthly permit increase ($) |
0.78 |
2.90 |
1.88 |
5.97 |
|
Notes by Line: |
|
|
1 |
Includes 350 visitor spaces in the Garage, and 250 visitor spaces at the Stadium site; all other spaces are for permit parking. |
|
2 |
The Garage eliminates 141 existing spaces, including 100 permits and 41 spaces for visitors. |
|
5 |
For Fram, annual expenses include $230,000 for a shuttle bus. |
|
7 |
The monthly increase for 7,700 permit holders needed to finance the annual operating loss in line 5. |
Conclusion
If our estimate of new construction over the next two decades is too high, we may be able to keep our academic buildings within the existing campus core for a period well beyond 20 years. Nonetheless, we should continue to think in the longer term of the need for space across Western Road, and to follow the directions of the Master Plan in that regard: keep Western Road as safe and quiet as possible; resist efforts to widen it substantially; plan carefully the use of Western land west of Western road; and work to obtain rights of first refusal on properties adjacent to Western land and owned by others.
In our planning for the next two decades, however, we should seek to locate our new teaching and research buildings in the traditional campus core, including the South Valley Site. If we are careful in our planning, we will maintain a beautiful campus core in a limited, well-defined area east of Western Road. That beauty will continue to be part of the definition of Western, for those who work and study here, and those whom we are seeking to recruit.
Notes