|
|
Primary Health Care System SEED FUNDING REPORTS
FINDINGSResult: Panel size can be measured using health Administrative data. One can:
Number of patients under the care of a provider Implication:
Background: The last 20 years have seen an increasing recognition of the importance of quality primary care to population health,1-3 including improved health status, 4,5 reduced mortality,6,7 and improved preventive care.8 Effective primary care also reduces the burden on other health care sectors.5 The effectiveness of primary care is maximized when it is optimally organized. There is considerable variability in the number of patients for which family physicians care. There is also good evidence that large patient loads are associated with reduced accessibility, 9-15 continuity,16 comprehensiveness, 17 and preventive care. 8 However, there is insufficient data to allow provincial health ministries or physician governing bodies to establish benchmarks or recommendations for the optimal range of patient numbers for which family physicians should be responsible. Studies that have attempted to establish such guidelines were based on workload formulas that relied on estimates of the number of visits required by patients each year in relation to the number of daily visits a physician can provide (# of days worked per year * # of visits per day ÷ # of patient visits per year). 16, 18 This approach is flawed because it only considers output and not quality. Benchmarks should consider the impact of patient numbers on the quality of care delivered. The few studies reporting on this subject were designed to meet other objectives, reported on the association between patient number and only one or two measures of quality, or contained a limited number of patients. 10-12, 14-17, 19-26 We are planning a study that relies on data housed at the Institute for Clinical Evaluative Sciences (ICES) to assess the relationship between the number of patients cared for by a family physician and the quality of care delivered by that physician for six essential primary care attributes. Because providers vary in the amount of time they spend in clinical care, we will use a measure of patient load that is adjusted for the amount worked termed Panel Size. This is further defined below. The use of health administrative data strengthens the statistical power of the study because of the large number of records available. However, the use of health administrative data also contributes to the limitation of the study because the data must be confined to pre-existing data. The study relies on two measures: performance and panel size. Several ICES primary care indicators have been used and are accepted measures of quality of care performance level. In that study we rely on 19 indicators to measures 6 dimensions of care. However, there are no existing measures of panel size measures in these data.
Research Objective: The objectives of this study were to:
Study Design: This cross sectional study covered the period spanning April 1st 2008 through March 31st 2010
Study Sample: Family Physician Inclusion: All family physicians working in a patient enrolment model and providing general care were included. We limited the evaluation to patient enrolment models for two reasons:
Because of the variability in the organization of patient enrolment models, we grouped the data into three groups based on the model’s remuneration and staffing structure:
Other enrolment models that are uncommon were excluded. Family Physician Exclusion: Family physicians having specialized practices (having NOT billed at least 8 of the 18 standard primary care fee schedule codes in the period under evaluation or determined by the Ontario Physician Human Resources Data Centre not to be generalists), those with fewer than 100 enrolled patients, and those with a prolonged absence (having not billed for a period exceeding 8 consecutive weeks in the two year period) were also excluded.
Patient Exclusion: Individuals were excluded if they did not have at least one primary care visit in the period under evaluation, or were less than 18 years old and had more than three visits to a paediatrician.
Measurement of Outcomes and Analyses: Panel size is the number of patients cared for by a family physician relative to the amount worked in one year. Panel size estimates require that the providers’ panel list (list of patients for whom they care) be identified and that a measure of their work be estimated. Number of patients under the care of a provider In this pilot evaluation, we explored the impact of assumptions we need to make to determine panel size. Assumption #1: Virtual Roster appropriately identifies providers A family physician’s panel list size is composed of patients formally enrolled to him/her and those receiving care from him/her but not officially enrolled. The large majority of patients receiving care from a family physician working in a patient enrolment model are enrolled to that doctor. That data is available in the Client Agency Enrolment Program (CAPE) database housed at ICES. Patients not enrolled to a family physician can be attributed to a family physician based on their pattern of care. The Ministry of Health and Long Term Care, a main stakeholder in this study, accepts the “Virtual Rostering” approach to assigning non enrolled patients to family physician. 27, 28 In that approach, patients are attributed to the family physician having billed (or “Shadow billed” in capitation models) the largest dollar amount of services (based on the fee for service schedule) for that patient (Source: OHIP) in the previous two years.
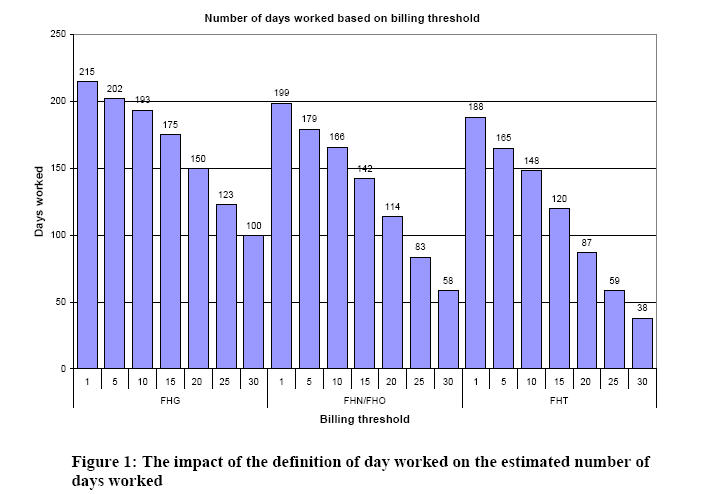
Assumption #2: The Number of visits per day can be used to estimate FTE There is no measure of amount worked by a family physician that can be exactly related to Full Time Equivalent (FTE). FTE estimates need to be derived from the number of days worked weekly. That, in turn, is sensitive to how a days’ work is defined. The only available measure of work in health administrative data is billings activity. We want to determine what the appropriate threshold for the number of daily visits (based on billings submitted) required to determine whether a day was worked for the purpose of estimated FTE.
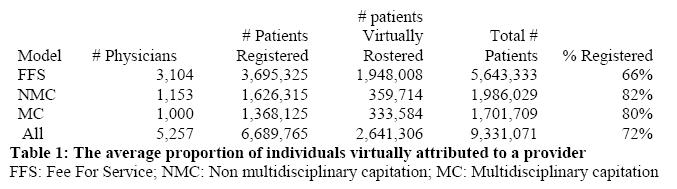
RESULTS: Assumption #1: Virtual Roster appropriately identifies providers -> This evaluation assesses how valid the assumption that the Virtual Roster approach identifies the appropriate provider. To determine the panel size measures, we assumed that virtual roster appropriately identifies providers if patients who are in fact registered to a provider and who were subjected to virtual rostering were correctly attributed to the provider to whom they were registered at least 80% of the time. The proportion of patients that make up the total panel of a physician who are actually registered with their provider (vs those who are attributed using the virtual rostering approach described earlier) is shown in Table 1. Overall, in the patient enrollment models eligible for this study, 72% of patients are formally registered with their provider. This differed considerably between the FFS model and the capitation models.
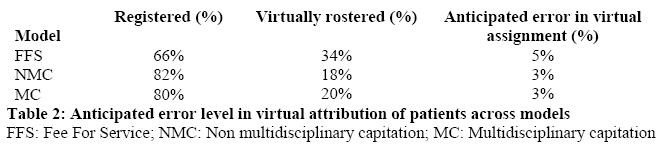
Therefore, the assessment we performed was on the 72% of patients already registered with their provider. The results of the virtual attribution of these patients show that, overall, 85% of enrolled patients are appropriately assigned to the physician to whom they are registered. We conclude that the approach is appropriate because no less than 80% of patients who are registered with a provider are correctly virtually attributed to that same provider. We assumed that the chance of incorrectly assigning a patient who is not registered to a provider is the same as the chance of incorrectly assigning patients who are registered (i.e. 15%) and estimated the impact of the 15% error level on panel size estimates. This error level would be highest for FHGs where more patients are virtually rostered. We estimated that 15% of the 35%, or 5% of all patients in a FFS panel, who are virtually rostered are correctly attributed to their provider. For capitation models, the error level is 3%. The expected error level is shown in Table 2:
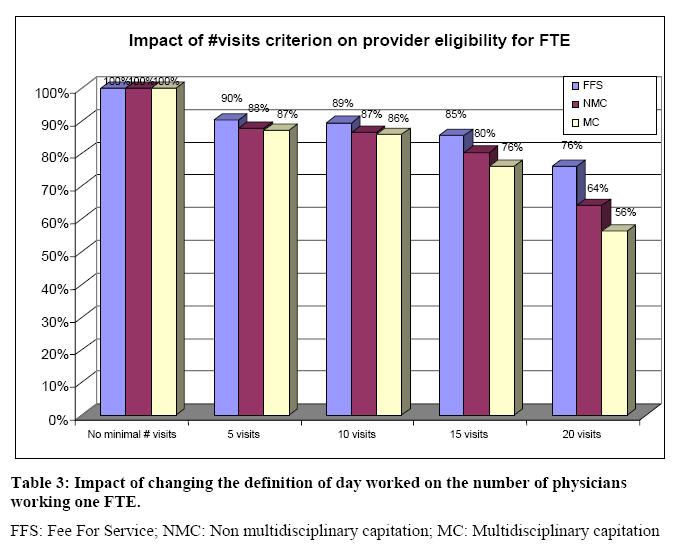
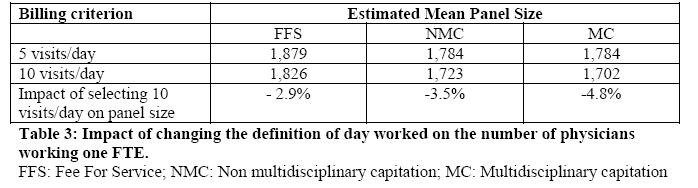
Assumption #2: The Number of visits per day can be used to estimate FTE -> This evaluates how sensitive is the measure of FTE to changes in the definition of the minimum number of visits required to determine that a day is worked First we assessed the impact of different cut off marks for the number of visits per day to deem that day worked on the number of physicians deemed to work full time in each model to determine which had the minimal differential impact across model. We investigated the impact of defining a “day worked” as 0, 5, 10, 15, or 20 visits per day. This is shown in Table 3. The results indicate that:
We conclude the 5 or 10 visit criteria are the most appropriate criteria to use because they have the least differential impact across models and because they yield a proportion of providers working full time that is consistent with reports from other studies
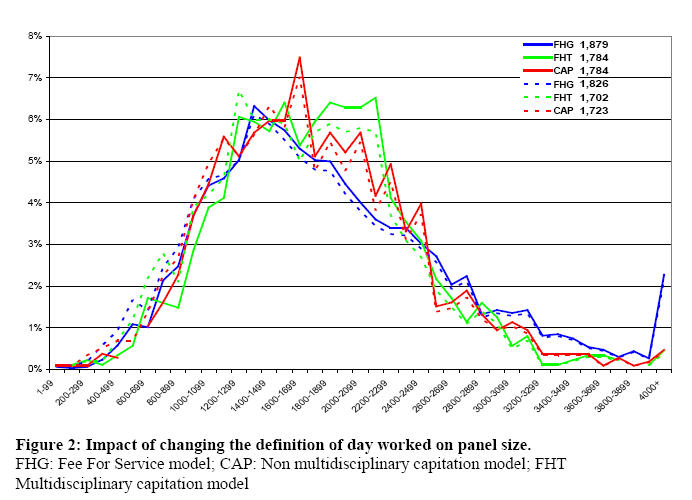
We then assessed the impact of these definitions (5 visits vs 10 visits) on panel size. The estimated panel size for providers working in each model given a definition of 5 visits and 10 visits are shown in Table 4. We find that selecting 10 visits per day reduces the panel size estimates 2.9%, 3.5%, and 4.8% in the Fee for Service, Non multidisciplinary capitation and multidisciplinary capitation, respectively
The impact of selecting 5 vs 10 visits on the distribution of panel size in each model is shown in Figure 2:
Implications for Primary Care Health administrative databases can be used to establish the panel size of primary care providers. Health administrative databases provide a reasonable approach to:
These factors are essential in establishing the family physician’s panel size which is defined as the number of patients under the care of a family physician working full time. There is currently insufficient data to allow provincial health ministries or physician governing bodies to establish benchmarks or recommendations for the optimal range of panel size for which family physicians should be responsible. In response to this need, we will be conducting a study using health administrative data assessing the relationship between panel size and quality of care in Ontario. Health administrative data is a reliable source of quality of care measures. Prior to this current evaluation, there had been no attempt to measure panel size using health administrative data. Establishing panel size using that data is the first step that will allow us to measure the relationship between panel size and quality of care. We are working closely with the Ministry of Health and Long Term Care to provide them with evidence based recommendations for benchmarks for optimal panel size ranges in primary care. |